In this second post in our series on intermediate to advanced macOS malware reversing, we start our journey into tackling common challenges when dealing with macOS malware samples. Last time out, we took a look at how to use radare2 for rapid triage, and we’ll continue using r2 as we move through these various challenges. Along the way, we’ll pick up tips on both how to beat obstacles put in place by malware authors and how to use r2 more productively.
Although we can achieve a lot from static analysis, sometimes it can be more efficient to execute the malware in a controlled environment and conduct dynamic analysis. Malware authors, however, may have other ideas and can set up various roadblocks to stop us doing exactly that. Consequently, one of the first challenges we often have to overcome is working around these attempts to prevent execution in our safe environment.
In this post, we’ll look at how to circumvent the malware author’s control flow to avoid executing unwanted parts of their code, learning along the way how to take advantage of some nice features of the r2 debugger! We’ll be looking at a sample of EvilQuest (password: infect3d), so fire up your VM and download it before reading on.
A note for the unwary: if you’re using Safari in your VM to download the file and you see “decompression failed”, go to Safari Preferences and turn off the ‘Open “safe” files after downloading’ option in the General tab and try the download again.
Getting Started With the radare2 Debugger
Our sample hit the headlines in July 2020, largely because at first glance it appeared to be a rare example of macOS ransomware. SentinelLabs quickly analyzed it and produced a decryptor to help any potential victims, but it turned out the malware was not very effective in the wild.
It may well have been a PoC, or a project still in early development stages, as the code and functionality have the look and feel of someone experimenting with how to achieve various attacker objectives. However, that’s all good news for us, as EvilQuest implements several anti-analysis features that will serve us as good practice.
The first thing you will want to do is remove any extended attributes and codesigning if the sample has a revoked signature. In this case, the sample isn’t signed at all, but if it were we could use:
% sudo codesign --remove-signature <path to bundle or file>
If we need the sample to be codesigned for execution, we can also sign it (remember your VM needs to have installed the Xcode command line tools via xcode-select --install) with:
% sudo codesign -fs - <path to bundle or file> --deep
We’ll remove the extended attributes to bypass Gatekeeper and Notarization checks with
% xattr -rc <path to bundle or file>
And we’ll attempt to attach to the radare2 debugger by adding the -d switch to our initialization command:
% r2 -AA -d patch
Unfortunately, our first attempt doesn’t go well. We already removed the extended attributes and codesigning isn’t the issue here, but the radare2 debugger fails to attach.
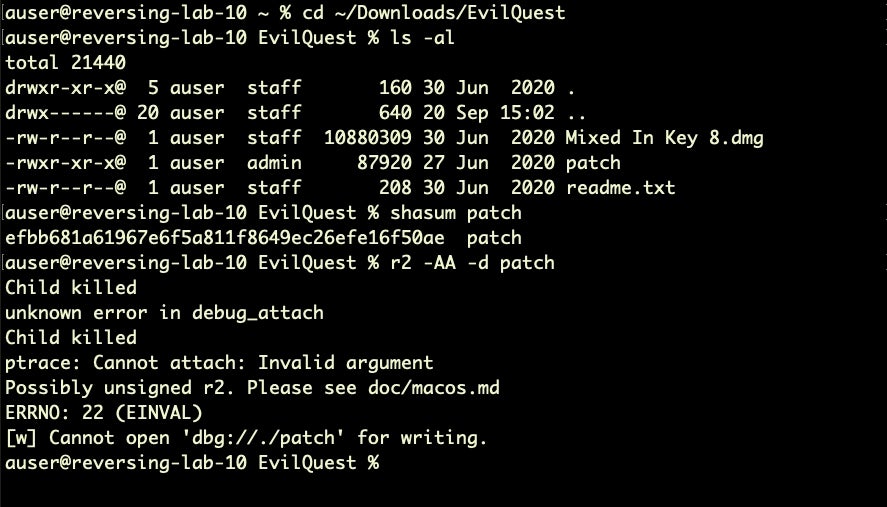
That ptrace: Cannot Attach: Invalid argument looks ominous, but actually the error message is misleading. The problem is that we need elevated privileges to debug, so a simple sudo should get us past our current obstacle.
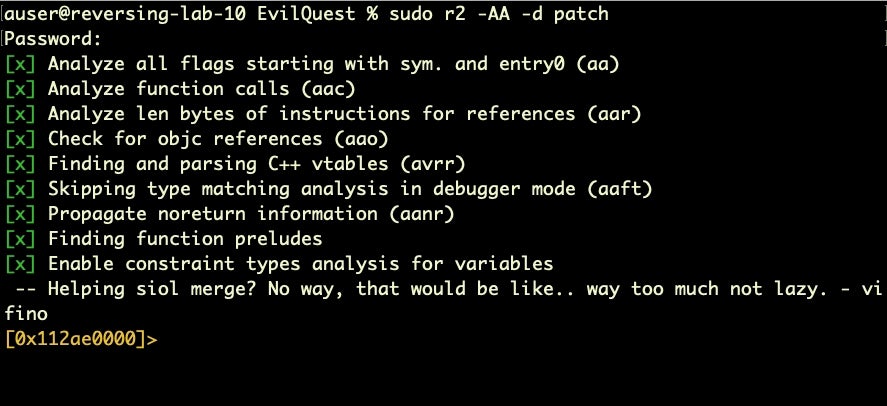
Yay, attach success! Let’s take a look around before we start diving further into the debugger.
A Faster Way of Finding XREFS and Interesting Code
Let’s run afll as we did when analyzing OSX.Calisto previously, but this time we’ll output the function list to file so that we can sort it and search it more conveniently without having to keep running the command or scrolling up in the Terminal window.
> afll > functions.txt
Looking through our text file, we can see there are a number of function names that could be related to some kind of anti-analysis.
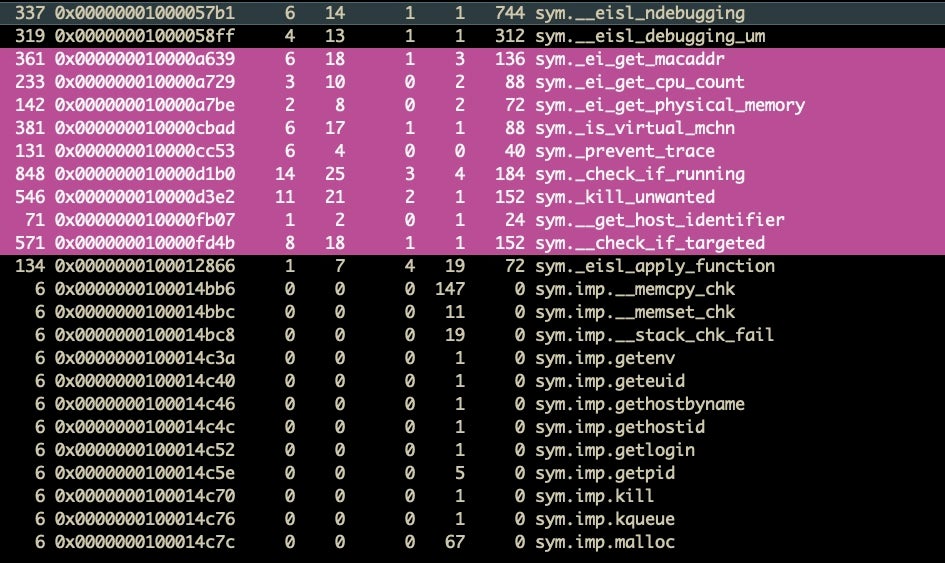
We can see that some of these only have a single cross-reference, and if we dig into these using the axt commmand, we see the cross-reference (XREF) for the is_virtual_mchn function happens to be main(), so that looks a good place to start.

axt command> axt sym._is_debugging main 0x10000be5f [CALL] sys._is_virtual_mchn

Here’s a useful powertrick for those already comfortable with r2. You can run any command on a for-each loop using @@. For example, with
axt @@f:<search term>
we can get the XREFS to any function containing the search term in one go.
In this case I tell r2 to give me the XREFS for every function that contains “_is_”. Then I do the same with “get”. Try @@? to see more examples of what you can do with @@.
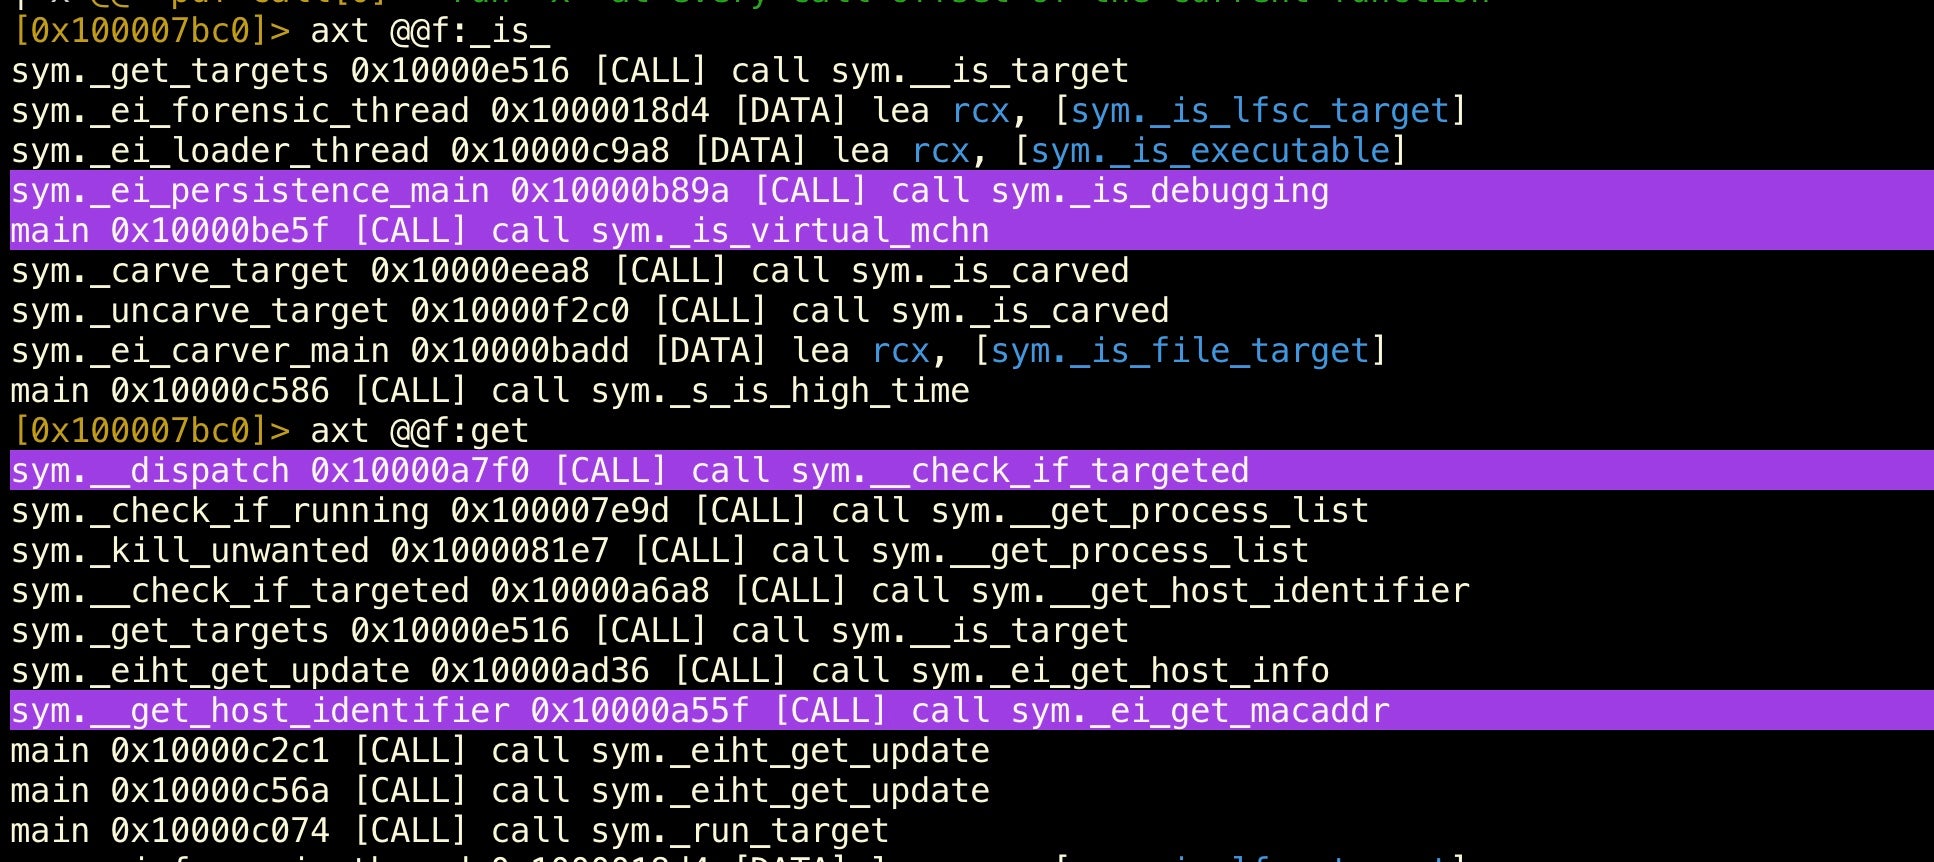
Since we see that is_virtual_mchn is called in main, we should start by disassembling the entire main function to see what’s going on, but first I’m going to change the r2 color theme to something a bit more reader-friendly with the eco command (try eco and hit the tab key to see a list of available themes).
eco focus
pdf @ main
Visual Graph Mode and Renaming Functions with Radare2
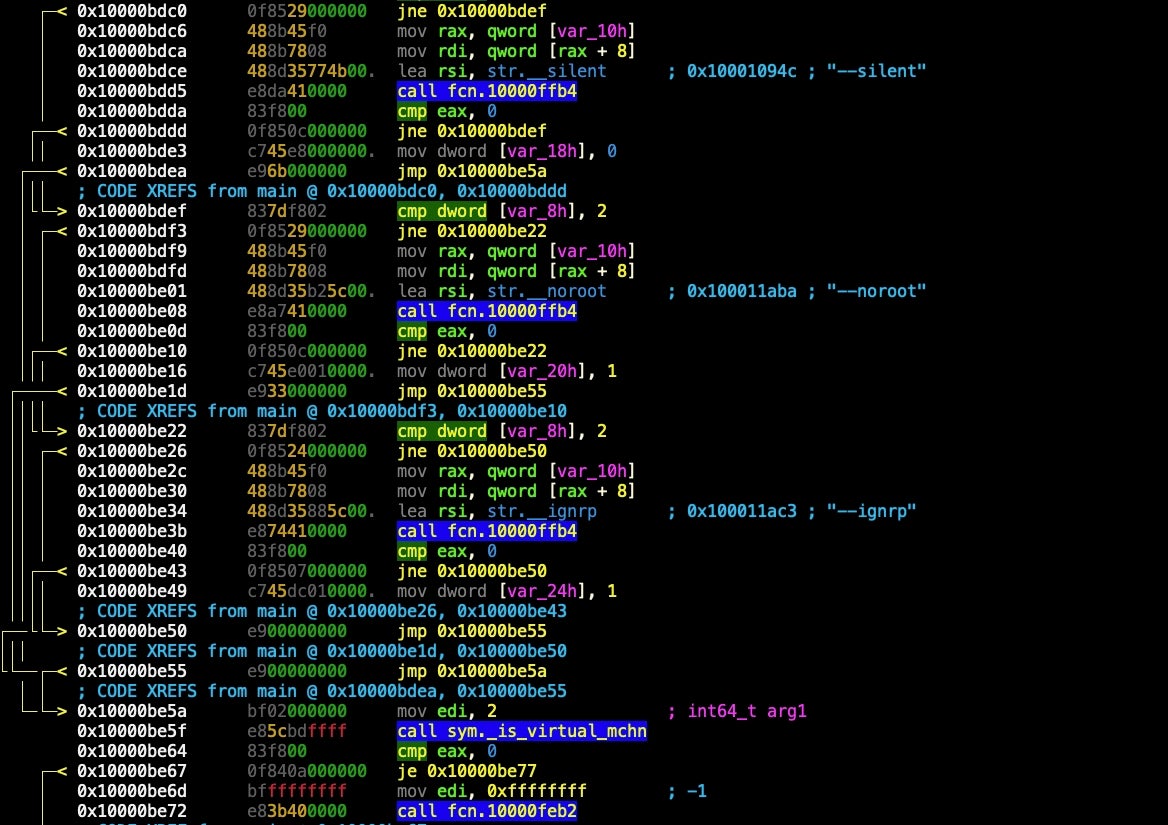
As we scroll back up to the beginning of the function, we can see the disassembly provides pretty interesting reading. At the beginning of main, we can see some unnamed functions are called. We’re going to jump into Visual Graph mode and start renaming code as this will give us a good idea of the malware’s execution flow and indicate what we need to do to beat the anti-analysis.
Hit VV to enter Visual Graph mode. I will try to walk you through the commands, but if you get lost at any point, don’t feel bad. It happens to us all and is part of the r2 learning curve! You can just quit out and start again if needs be (part of the beauty of r2’s speed; you can also save your project: type uppercase P? to see project options).
I prefer to view the graph as a horizontal, left-to-right flow; you can toggle between horizontal and vertical by pressing the @ key.
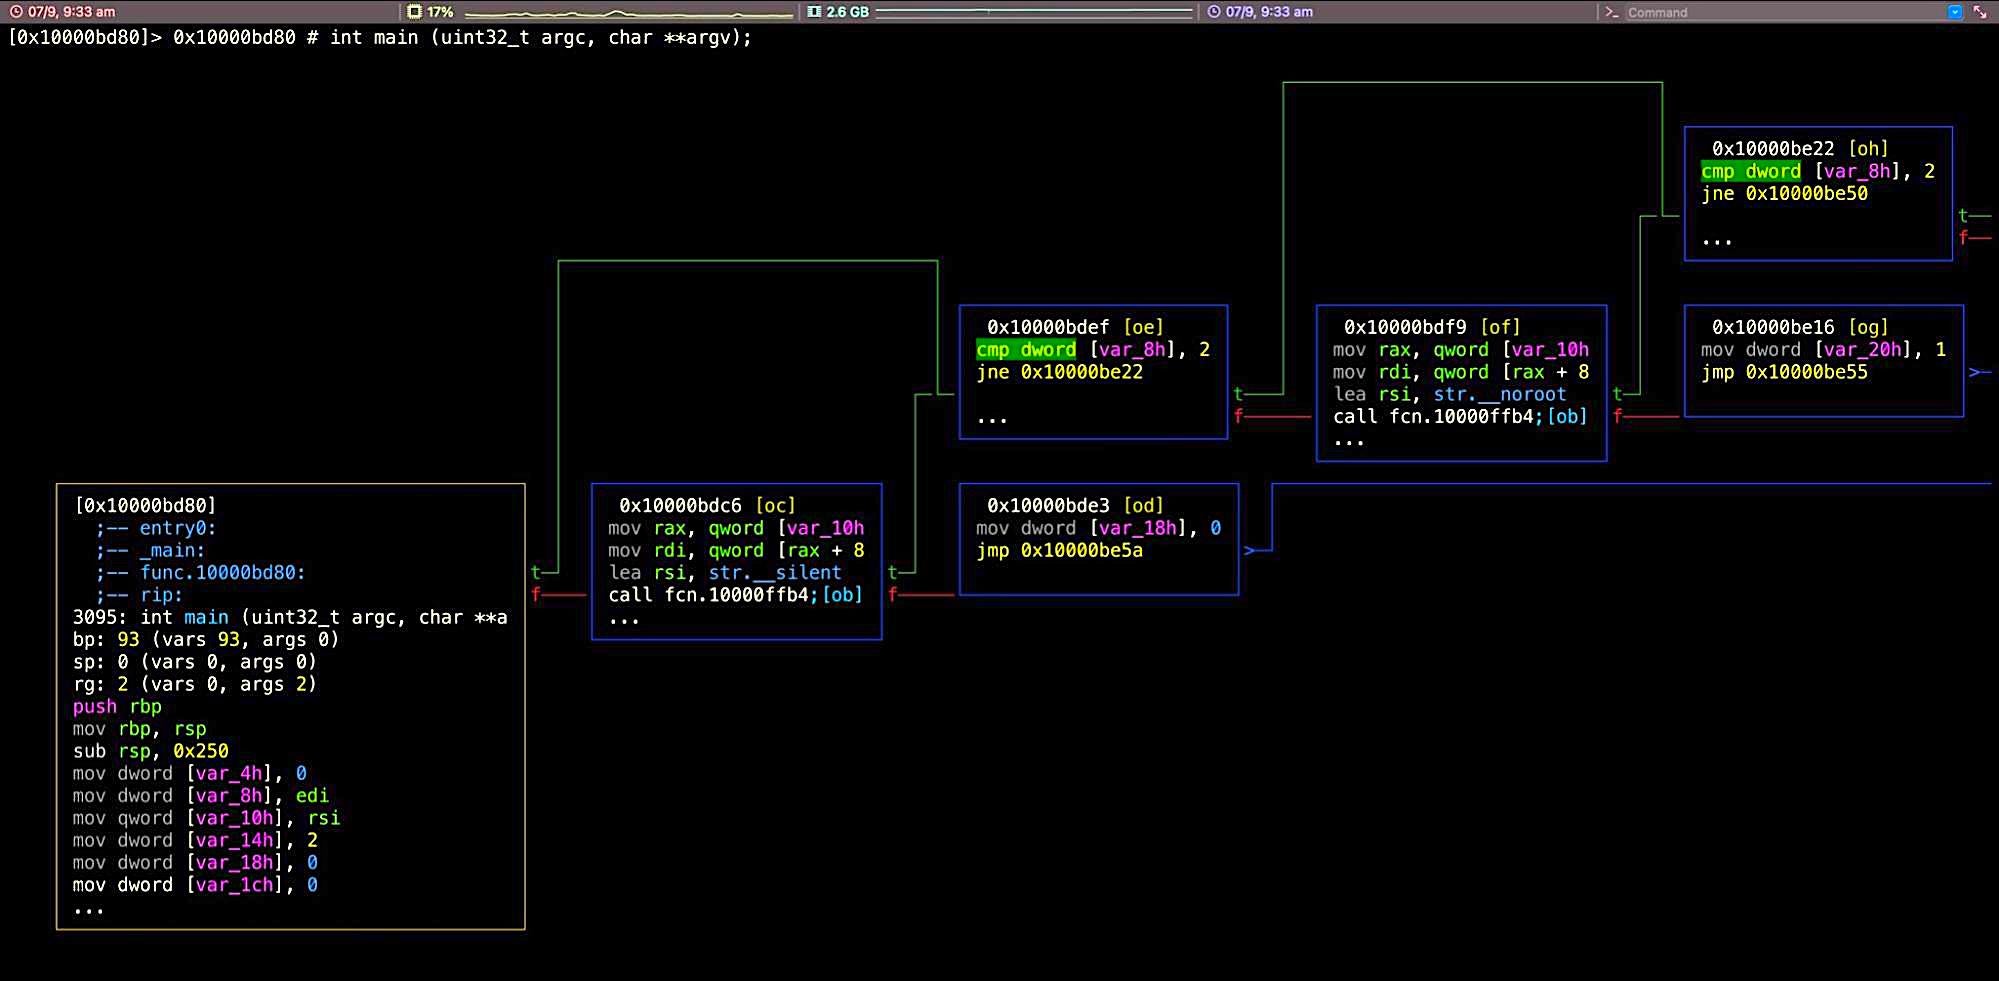
Here’s a quick summary of some useful commands (there are many more as you’ll see if you play around):
- hjkl(arrow keys) – move the graph around
- -/+0 – reduce, enlarge, return to default size
- ‘ – toggle graph comments
- tab/shift-tab – move to next/previous function
- dr – rename function
- q – back to visual mode
- t/f – follow the true/false execution chain
- u – go back
- ? – help/available options
Hit ‘ once or twice make sure graph comments are on.
Use the tab key to move to the first function after main() (the border will be highlighted), where we can see an unnamed function and a reference in square brackets that begins with the letter ‘o’ (for example, [ob], though it may be different in your sample). Type the letters (without the square brackets) to go to that function. Type p to rotate between different display modes till you see something similar to the next image.
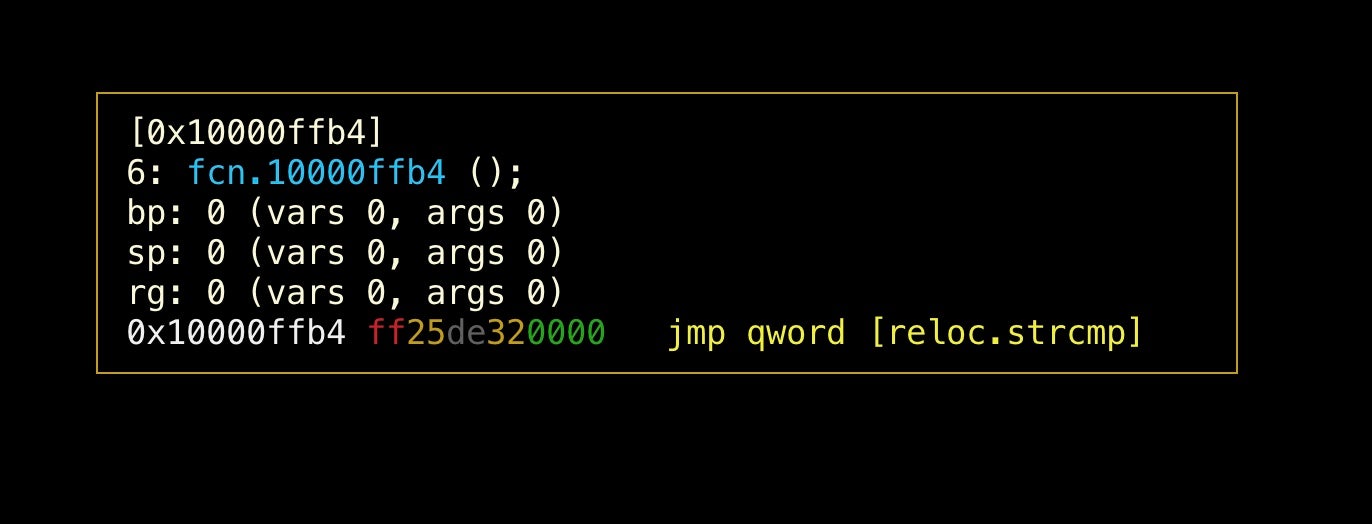
As we can see, this function call is actually a call to the standard C library function strcmp(), so let’s rename it.
Type dr and at the prompt type in the name you want to use and hit ‘enter’. Unsurprisingly, I’m going to call it strcmp.
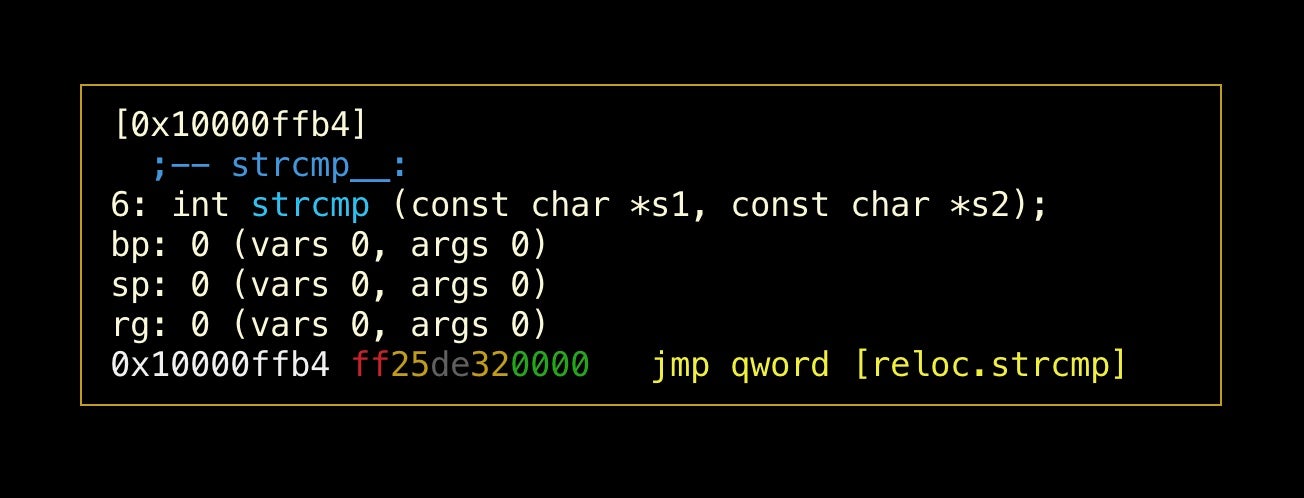
To return to the main graph, type u and you should see that all references to that previously unnamed function now show strcmp, making things much clearer.
If you scroll through the graph (hjkl, remember) you will see many other unnamed functions that, once you explore them in the same way, are just relocations of standard C library calls such as exit, time, sleep, printf, malloc, srandom and more. I suggest you repeat the above exercise and rename as many as you can. This will both make the malware’s behaviour easier to understand and build up some valuable muscle-memory for working in r2!
Beating Anti-Analysis Without Patching
There are two approaches you can take to interrupt a program’s designed logic. One is to identify functions you want to avoid and patch the binary statically. This is fairly easy to do in r2 and there’s quite a few tutorials on how to patch binaries already out there. We’re not going to look at patching today because our entire objective is to run the sample dynamically, so we might as well interact with the program dynamically as well. Patching is really only worth considering if you need to create a sample for repeated use that avoids some kind of unwanted behaviour.
We basically have two easy options in terms of affecting control flow dynamically. We can either execute the function but manipulate the returned value (like put 0 in rax instead of 1) or skip execution of the function altogether.
We’ll see just how easy it is to do each of these, but we should first think about the different consequences of each choice based on the malware we’re dealing with.
If we NOP a function or skip over it, we’re going to lose any behaviour or memory states invoked by that function. If the function doesn’t do anything that affects the state of our program later on, this can be a good choice.
By the same token, if we execute the function but manipulate the value it returns, we may be allowing execution of code buried in that function that might trip us up. For example, if our function contains jumps to subroutines that do further anti-analysis tests, then we might get blocked before the parent function even returns, so this strategy wouldn’t help us. Clearly then, we need to take a look around the code to figure out which is the best strategy in each particular case.
Let’s take a look inside the _is_virtual_mchn function to see what it would do and work out our strategy.
If you’re still in Visual Graph mode, hit q to get back to the r2 prompt. Regardless of where you are, you can disassemble a function with pdf and the @ symbol and provide a flag or address. Remember, you can also use tab expansion to get a list of possible symbols.
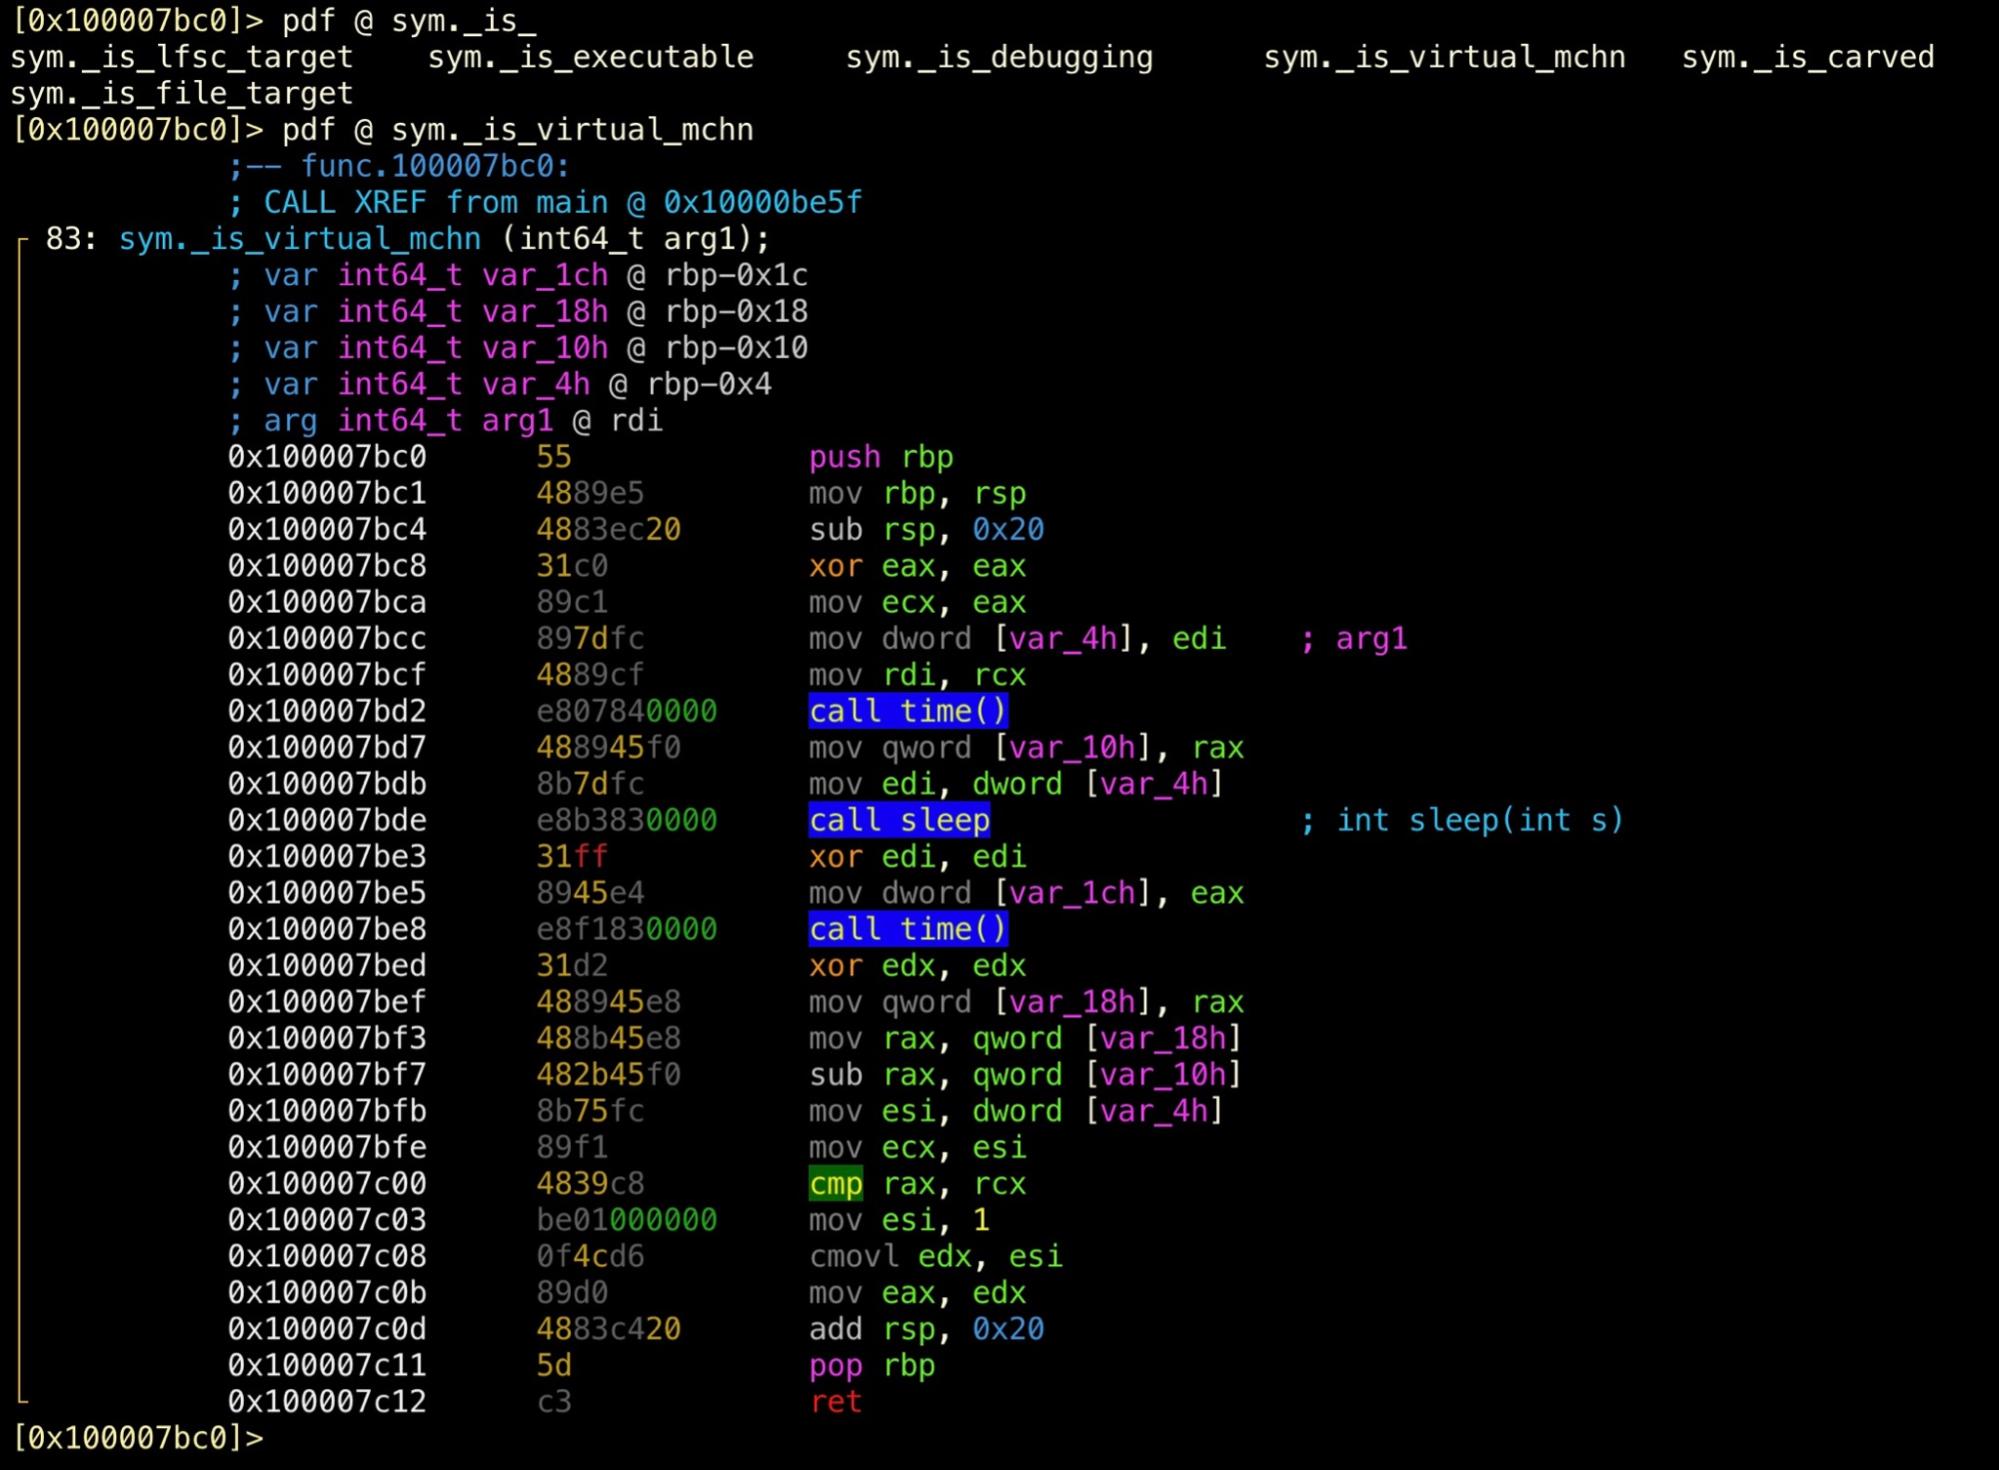
It seems this function subtracts the sleep interval from the second timestamp, then compares it against the first timestamp. Jumping back out to how this result is consumed in main, it seems that if the result is not ‘0’, the malware calls exit() with ‘-1’.

The function appears to be somewhat misnamed as we don’t see the kind of tests that we would normally expect for VM detection. In fact, it looks like an attempt to evade automated sandboxes that patch the sleep function, and we’re not likely to fall foul of it just by executing in our VM. However, we can also see that the next function, user_info, also exits if it doesn’t return the expected value, so let’s practice both the techniques discussed above so that we can learn how to use the debugger whichever one we need to use.
Manipulating Execution with the radare2 Debugger
If you are at the command prompt, type Vp to go into radare2 visual mode (yup, this is another mode, and not the last!).
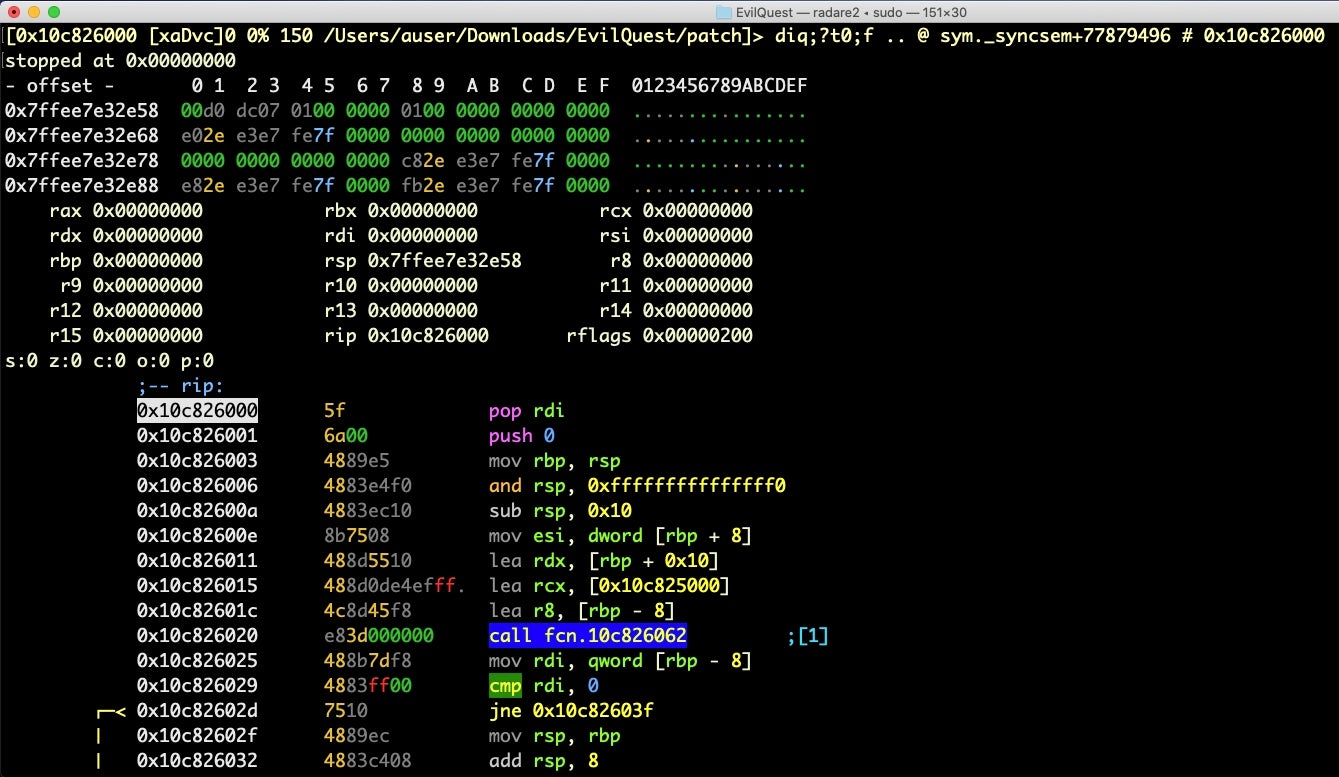
Ooh, this is nice! We get registers at the top, and source code underneath. The current line where we’re stopped in the debugger is highlighted. If you don’t see that, hit uppercase S once (i.e., shift-s), which steps over one source line, and – in case you lose your way – also brings you back to the debugger view.
Let’s step smartly through the source with repeated uppercase S commands (by the way, in visual mode, lowercase ‘s’ steps in, whereas uppercase ‘S’ steps over). After a dozen or so rapid step overs, you should find yourself inside this familiar code, which is main().
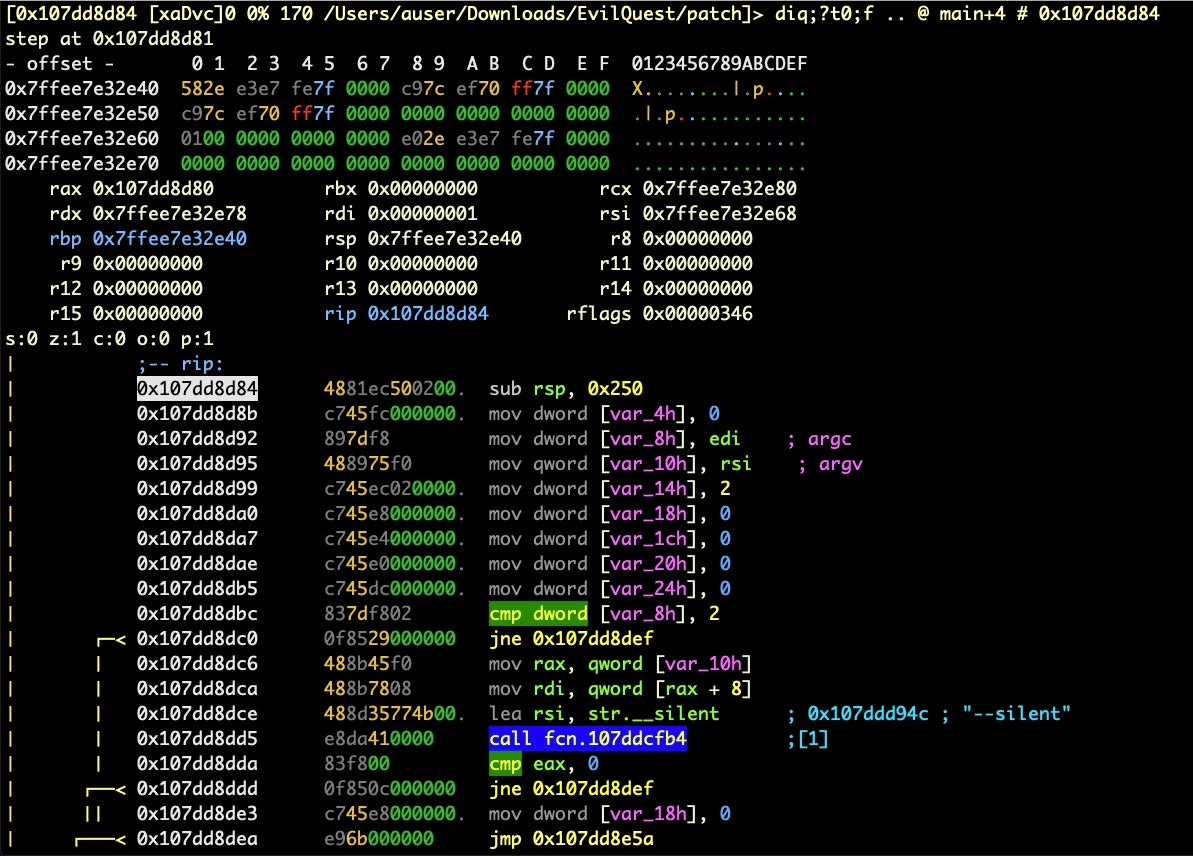
Note the highlighted dword, which is holding the value of argc. It should be ‘2’, but we can see from the register above that rdi is only 1. The code will jump over the next function call, which if you hit the ‘1’ key on the keyboard you can inspect (hit u to come back) and see this is a string comparison. Let’s continue stepping over and let the jump happen, as it doesn’t appear to block us. We’ll stop just short of the is_virtual_mchn function.
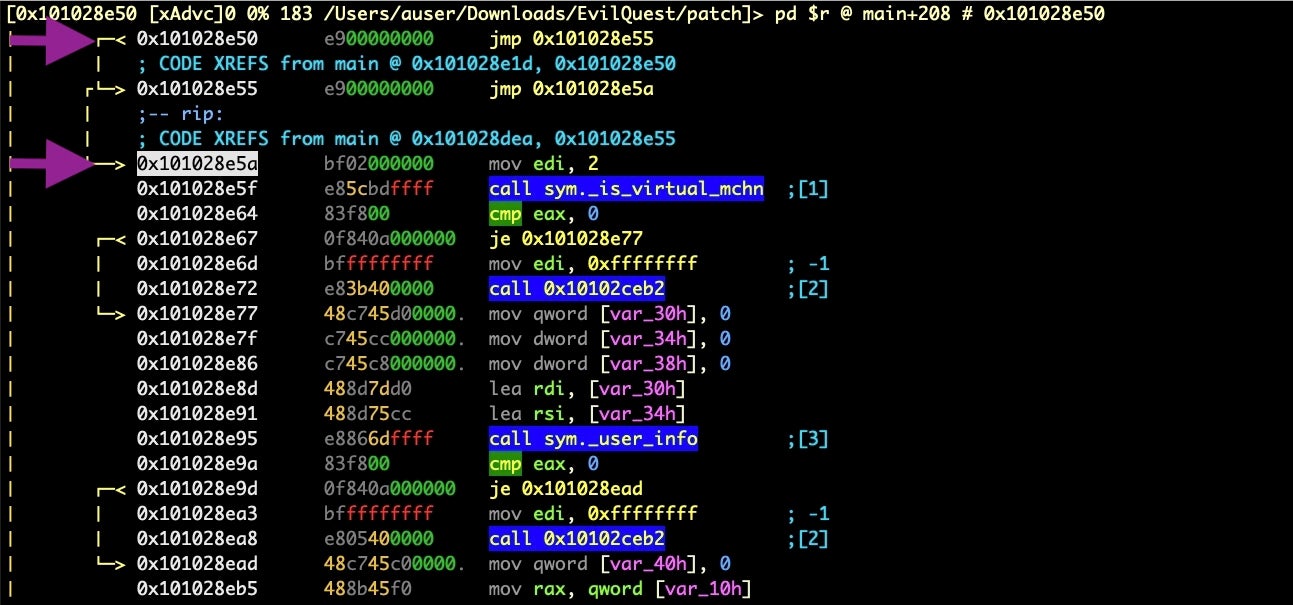
We know from our earlier discussion what’s going to happen here, so let’s see how to take each of our options.
The first thing to note is that although the highlighted address is where the debugger is, that’s not where you are if you enter an r2 command prompt, unless it’s a debugger command. To see what I mean, hit the colon key to enter the command line.
From there, print out one line of disassembly with this command:
> pd 1
Note that the line printed out is r2’s current seek position, shown at the top of the visual view. This is good. It means you can move around the program, seek to other functions and run other r2 commands without disturbing the debugger.
On the other hand, if you execute a debugger command on the command line it will operate on the source code where the debugger is currently parked, not on the current seek at the top of your view (unless they happen to be the same).
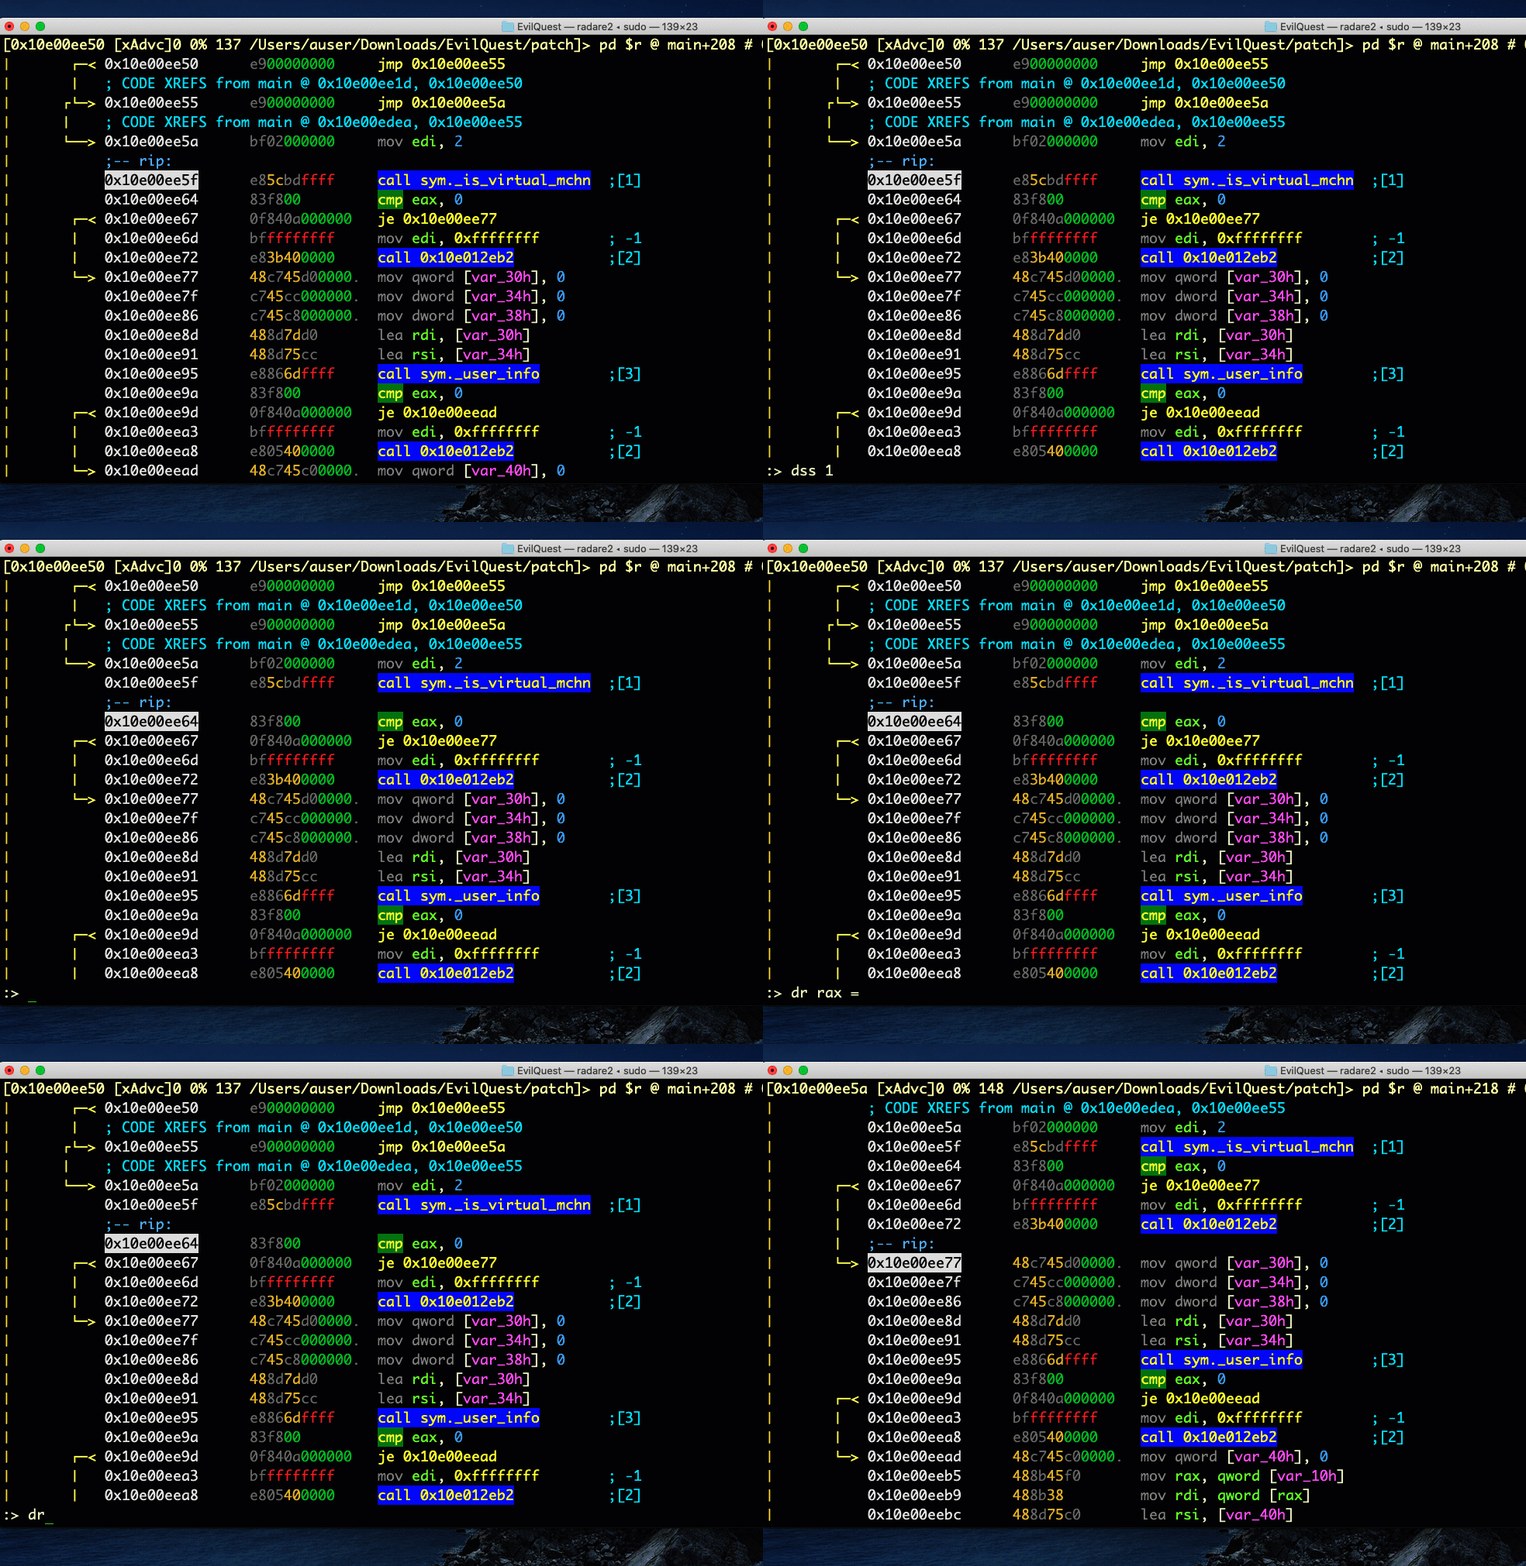
OK, let’s entirely skip execution of the _is_virtual_mchn function by entering the command line with : and then:
> dss 2
Hit ‘return’ twice. As you can see, the dss command skips the number of source lines specified by the integer you gave it, making it a very easy way to bypass unwanted code execution!
Alternatively, if we want to execute the function then manipulate the register, stop the debugger on the line where the register is compared, and enter the command line again. This time, we can use dr to both inspect and write values to our chosen register.
> dr eax // see eax’s current value
> dr eax = 0 // set eax to 0
> drr // view all the registers
> dro // see the previous values of the registers
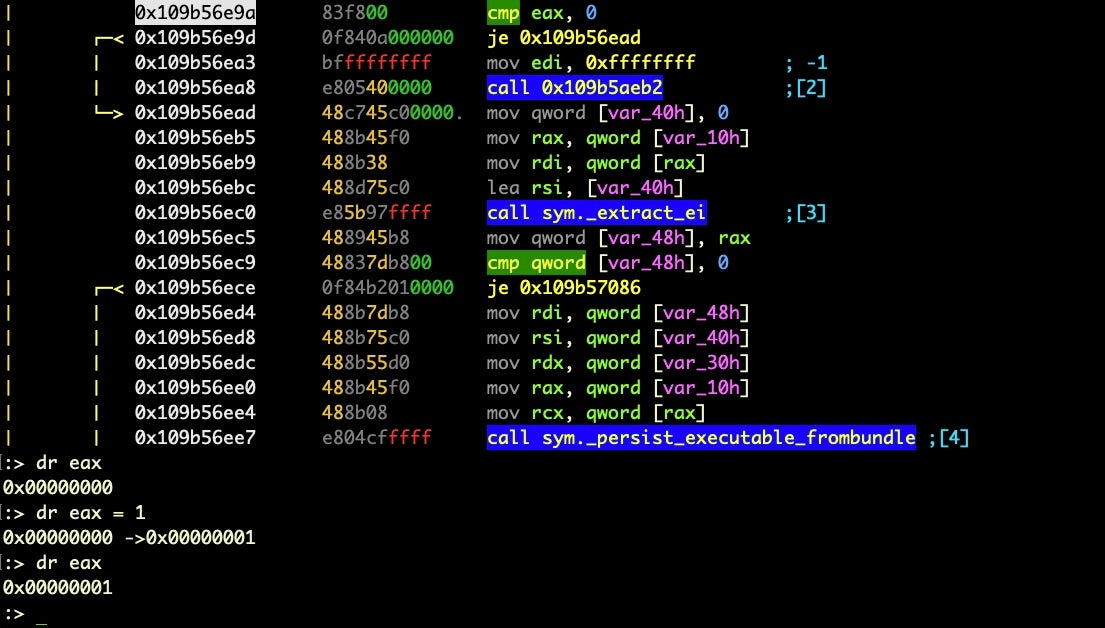
And that, pretty much, is all you need to defeat anti-analysis code in terms of manipulating execution. Of course, the fun part is finding the code you need to manipulate, which is why we spent some time learning how to move around in radare2 in both visual graph mode and visual mode. Remember that in either mode you can get back to the regular command prompt by hitting q. As a bonus, you might play around with hitting p and tab when in the visual modes.
At this point, what I suggest you do is go back to the list of functions we identified at the beginning of the post and see what they do, and whether it’s best to skip them or modify their return values (or whether either option will do). You might want to look up the built-in help for listing and setting breakpoints (from a command prompt, try db?) to move quickly through the code. By the time you’ve done this a few times, you’ll be feeling pretty comfortable about tackling other samples in radare2’s debugger.
Conclusion
If you’re starting to see the potential power of r2, I strongly suggest you read the free online radare2 book, which will be well worth investing the time in. By now you should be starting to get the feel of r2 and exploring more on your own with the help of the ? and other resources. As we go into further challenges, we’ll be spending less time going over the r2 basics and digging more into the actual malware code.
In the next part of our series, we’re going to start looking at one of the major challenges in reversing macOS malware that you are bound to face on a regular basis: dealing with encrypted and obfuscated strings. I hope you’ll join us there and practice your r2 skills in the meantime!


