Previously, we covered how to get started with logging in C#, Java, Python, and Ruby. Now, we’ll take a look at Node.js logging. As in the other articles, we’ll cover:
- How to log very basically.
- What to log and why.
- How to log using a logging framework.
We’ll also accompany everything with practical examples so you can get started with logging in Node.js quickly and easily.

The Simplest Node.js Logging That Could Possibly Work
Let’s write a small Node.js application that logs incoming requests. For this demo, I’ll be using Visual Studio Code, but any editor or IDE will do.
Also, make sure you’ve installed the latest version of Node.js and npm. Currently, their LTS version (recommended for most users) are 14.16.0 and 6.14.11, respectively.
Finally, we’ll have to run some commands from the command line. You can use the terminal of your choice.
I use GitBash because it integrates nicely with Git, but you should be fine with the default terminal of your operating system.
Create a new folder and open a command line in it. Initialize a new project by running “npm init”:

This will result in several questions you need to answer. For the sake of this demo, most can be left empty so that the default values are used.
The output will look like this:
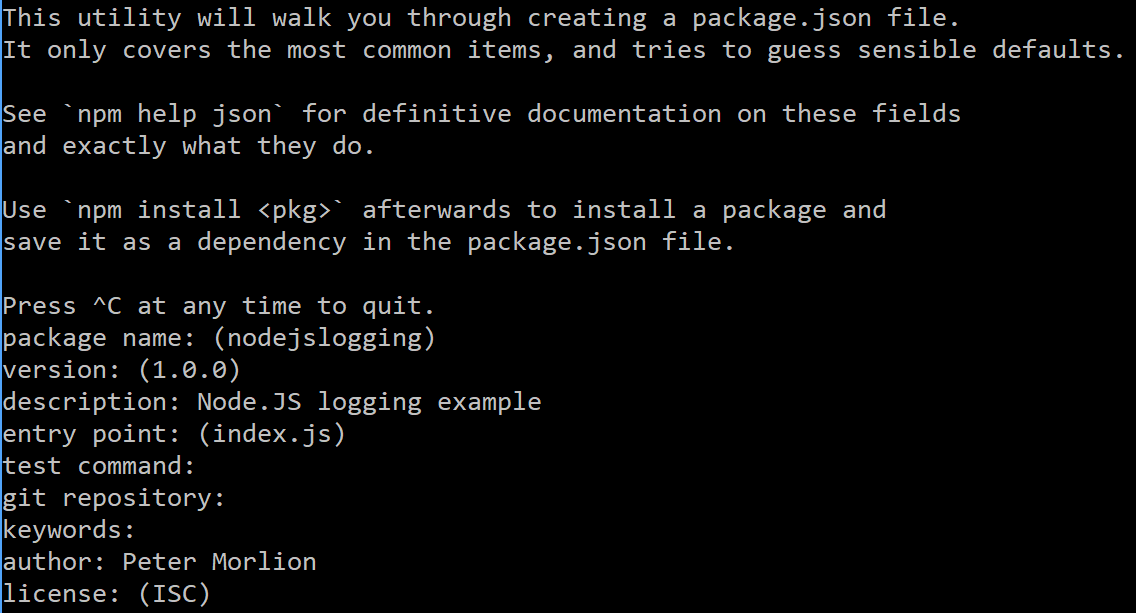
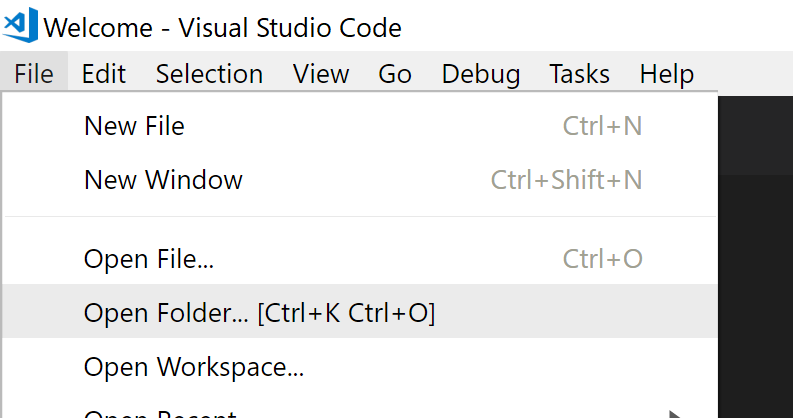
In the above example, we’ve defined index.js as our entry point. So let’s create that file now. Open Visual Studio Code, and open the folder we’ve created:
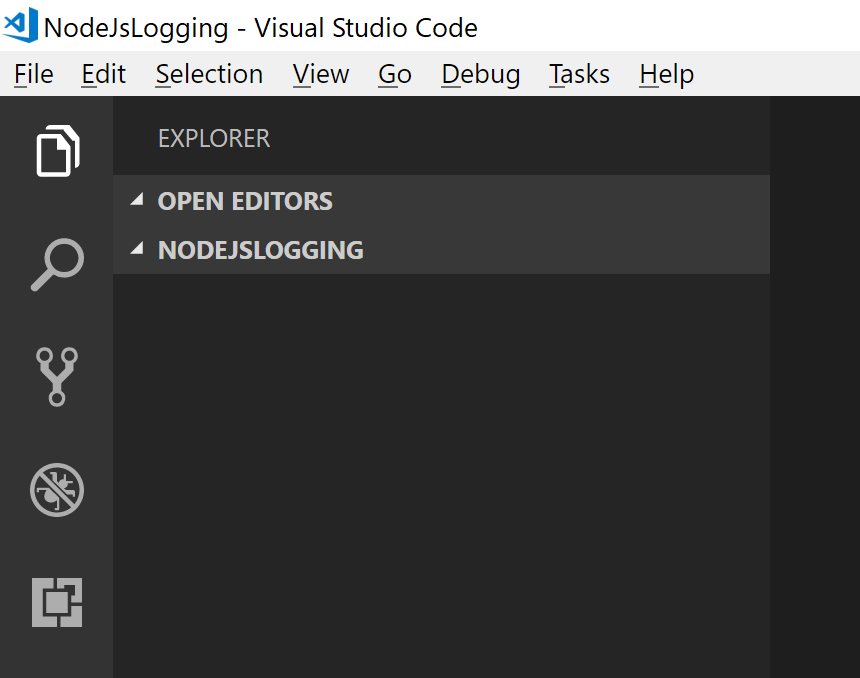
In the left pane, you’ll see there aren’t any files or folders yet:
When you hover your mouse pointer over the left pane, you’ll see an icon to add a file:
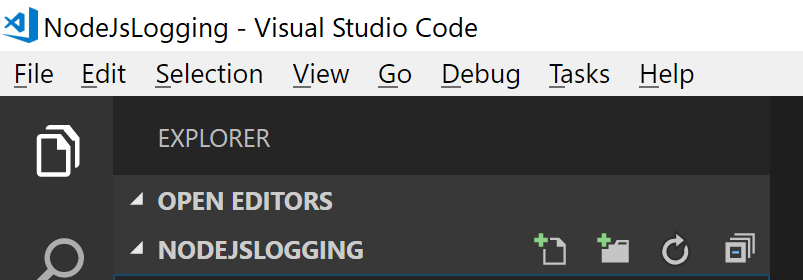
To be clear, this is the icon we want to use:

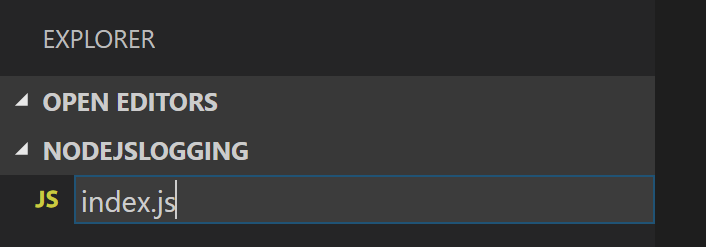
Name the file index.js and press ENTER.
We’ll be writing a simple web application that returns an HTTP 200 result when called. First, we need the HTTP module:
let http = require('http');
Then, we need to create a server and let it listen to a port:
http.createServer(onRequest).listen(8080);
We passed a callback function to the “createServer” method, so let’s define that function. This function should accept a “request” and a “response” object.
The request object can be used to investigate what the client sent to our server. The response object can be used to manipulate the response we’ll be sending back to the client.
This is our simple onRequest function:
function onRequest(request, response) {
    response.writeHead(200);
    response.end();
}
The end result looks like this:
let http = require('http');

http.createServer(onRequest).listen(8080);

function onRequest(request, response) {
    response.writeHead(200);
    response.end();
}
Now you can run this from the command line by running “node index.js.” To check if everything is running fine, you can point a tool like Postman to “localhost:8080” and see that it returns an HTTP 200 result.
If you don’t have Postman installed, your browser’s developer tools will do fine too.
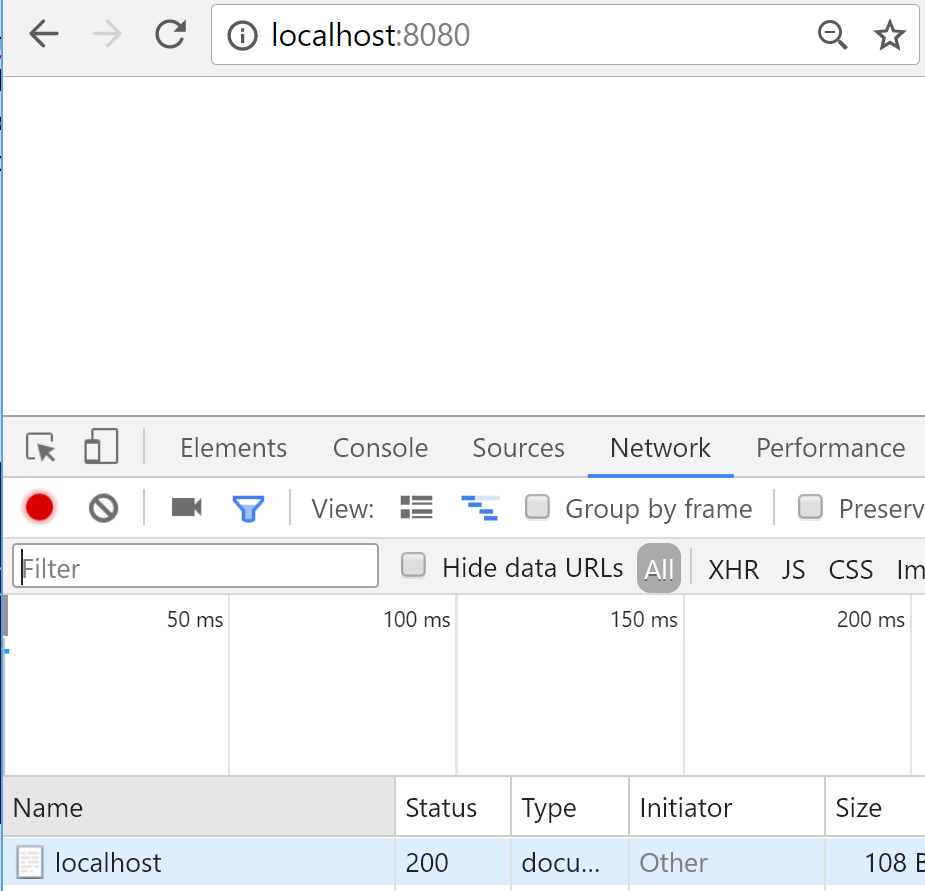
For example, open Chrome and press F12. You will see the developer tools.
Click on the “Network” tab and you’ll see all network traffic as it happens:

In the screenshot below, I’ve used Chrome to see the requests and responses to our demo application. As you can see, I get back my HTTP 200.
Stop the application by pressing CTRL+C.
The simplest way we can add logging now is to call “console.log”:
function onRequest(request, response) {
    console.log('A request was received');

    response.writeHead(200);
    response.end();
}
Start the application again (with “node index.js”). When you make your requests now, you’ll see the message in the console:

Notice how I received two requests: one for the URL I entered in the browser, and another for favicon.ico.
This last request is a default one the browser makes. If you’re using Postman, you’ll only see one log message.
A logical extension to this simple example would be to log to a file. After all, we want to be able to read the logs in cases where we don’t have access to the console.
Node.js has a filesystem API that provides the mechanism to achieve this. Make a call to “fs.appendFile” and continue handling the request in its callback:
let http = require('http');
let fs = require('fs');

http.createServer(onRequest).listen(8080);

function onRequest(request, response) {
    fs.appendFile('log.txt', 'A request was received\n', (err) => {
        response.writeHead(200);
        response.end();
    });
}
This code will result in the same message produced before it was appended at the end of a log.txt file.
Of course, there are many shortcomings to this code. For example, it has no concept of log levels (e.g., info, error, warn, trace, etc.).
Another issue is that we can’t easily write a message to another medium (a database, an email, etc.). And in general, we shouldn’t be writing our own logging framework when existing libraries do a better job at it.
Let’s take a step back and figure out what it is we want to do.
What Is Application Logging?
In our first article in this “Getting Started Quickly” series, we defined application logging as follows:
Application logging involves recording information about your application’s runtime behavior to a more persistent medium.
So in our simple example, our log message actually did record information about our application’s runtime behavior (the fact that we received a request).
And it did record this to a persistent medium (the filesystem).
What’s the Motivation for Logging?
So why, then, do we log?
The definition of logging that we just revisited already contains this information, though it may not be obvious at first sight.
Two pieces of information are important here:
- First, the fact that we record the behavior of our application, and
- second, that we record to a persistent medium.
Why a persistent medium? Because we want to get to the logs later. This can be hours, days, or even months later.
And why do we want information about our application’s behavior?

Because software is inherently complex, and as developers, we must admit we cannot foresee every situation our application will find itself in.
Users may enter invalid data we didn’t think about. Our server may start having hardware issues. Other services we depend upon might stop working. Anything can happen.
Logging can provide us with all this information after the fact.
With the motivation for logging discussed let’s start to take a look under the hood at the finer details of logging, starting with logging formats.
A Common Sense Logging Format
Generally speaking, a good log message contains at least three vital pieces of information.
- A timestamp — So that we can compare entries based on their time output.
- A log level — To tell use how descriptive or severe our log is.
- A message — To give us details about our log.
But that still leaves us with the question: What should we log?
Let’s cover that now.
Data You Shouldn’t Log
Okay, actually let’s take a step back. Before we discuss the important things we should log in our application, let’s briefly discuss a hurdle that stands in our way. What hurdle do I refer to? It’s that whilst we may want to we can’t log all data all of the time. Policies such as the EU’s GDPR work to protect users from their data being breached and logs pose a threat to our users data.
Some examples of data that we shouldn’t log are:
- account numbers
- passwords
- credit card numbers
- encryption keys
- social security numbers,
- and email addresses.
Now that we know we should tread carefully to not log personal and/or financial information it brings us back to our original question: What should we log?
What Should We Log?
A good logging strategy takes into account the individual nature of a service. Every service is different and performs different actions. A good start would be to ask yourself: “What data would I start logging if I saw a bug in my application?” and that will guide you towards the data that you might want to emit from your application.
Once you’ve got data logging from your application the best way to determine how valuable your logs are is to use them. Set yourself the task of making requests (especially failing ones) to a demo server and try ask questions of your system: “How many times did X user call the system?”, “What common properties do failing requests have?”, “How long does the service take to complete on average?”
Who Uses Logs?
I’ve been talking about “we”, but who’s the “we” that does the logging? Who are the actual people in an organization that benefit from logging?
Well, as already mentioned, software engineers and operations folks use logging for troubleshooting problems. Due to how complex software is, there’s no way to completely insulate an application
from defects. That would be great, but the next best thing is to closely monitor the app in production and record how it behaves.
Troubleshooting is far from being the only thing logging is useful for, though. UX professionals might use logs to understand how users interact with the application and use that knowledge to design better experiences.
In a similar way, logging can help in A/B testing, by enabling product managers to understand how different groups react to distinct versions of the same feature.
Even marketers can benefit from logs, leveraging them to track user engagement in response to campaigns.
In short, logging benefits the whole organization, but its advantages are only fully appreciated when once you put proper log management in place. That’s a conversation for another time, though. For now, let’s continue focusing on the basics: to which parts of your application should you add logging to?

A Starting Point of What to Log
Even without knowing what type of application you’re writing we can make some assumptions and give you a few best practices. The following are a few scenario’s that you should consider to add logging:
Access Logs — When a user accesses your service you’ll want to know: Who are they? What is their user ID? Were they authenticated? What is their current location? What browser did they use? Which headers did they send?
Integration Points — Another common area for failures is when your service calls over the network to another. You might want to log the data that is sent, and the response (or error message) that is returned.
Performance Logs — You may want to log timing data, such as how long a request takes to fulfil or how long a third-party integration takes to fulfil.
These are just a few areas that you might want to log. But as we said before, start instrumenting your service with logs and use them as much as you can. It will then become more obvious what log data you’re missing and may want to add.
Now that we’ve covered what data we may want to emit in our logs let’s take a look into how logging works under the hood for Node.js.
Node.js Logging and Streams – How Do They Work?
If you are familiar with Linux, you know different streams exist: stdin, stdout, and stderr. The stdin stream is used for accepting input, such as keyboard input or other text-based input. Actually, we are more interested in stdout and stderr for Node.js logging.
Both streams are output streams. Any output text coming from the command line to the shell is delivered via output streams. Regular output messages are delivered via stdout while error messages are delivered to stderr.
So, what’s the link with Node.js logging? When you use any of the below commands, you are sending output to stdout:
- console.log()
- console.info()
- console.debug()
When you use console.warn() or console.error(), the messages are sent to the stderr output stream. This distinction is particularly useful for segregating normal output from error output. Most often, developers want to monitor the error stream without having to monitor the stdout stream. Cool, right?
Now, let’s explore how to leverage a log framework to make our lives easier.
Logging Frameworks: What They Are and Why You Need One
Logging is, in essence, quite simple. Write some message to a file, and you’re done. But once you get into the details of logging, it isn’t quite so straightforward anymore.
As I’ve mentioned, there’s the matter of multiple destinations. But you need to address other issues, too:
- How do you avoid the log file becoming too large?
- Do we need to worry about file access permissions, concurrent file access, etc.?
- Do we need to write our own code to add the timestamp, log levels, and other information?
- What if I want to log certain messages to one medium and others to another medium?
When you look at it like that, the simple task of logging becomes quite a daunting one. And shouldn’t we be focusing on the business problem we’re trying to solve?
Luckily, other developers have worked out mature solutions that will most likely fit your needs. These solutions come in the form of a logging framework.

A logging framework is a package that allows you to log a message with one line of code. All you need to do is set up some configuration first, and the library will make sure your log messages are consistent and contain all information you require. Unlike Python or Ruby,
Node.js Logging Framework Options
Node.js does not have a built-in logging framework. But there are several npm packages that provide the functionality we need. Most libraries are similar, so the best thing to do is try them yourself, however I’m going to talk you through the main selling points of each in case these are particularly important for your use case.
Winston — The big selling point of Winston is it’s transports functionality which allows you to easily configure where your logs are shipped.
Pino — The big selling point of the Pino library is speed. Pino works to try and ensure your application keeps running quickly even when you emit large volumes of log data.
Bunyan — A feature rich library that does a few things out of the box for you such as appending various data items to your log entries and emitting in JSON (considered a good practice).
Morgan — A lightweight request logger middleware for Node.js. Provides developers with an easy way to define a logging format with various customization options. For instance,
morgan(':method :url :status :res[content-length] - :response-time ms')
Node-loggly — A small logging library compliant with the Loggly API. Especially useful as it can automatically convert JSON objects to strings.
For today we’ll make the decision for you and go ahead with Winston. Winston is possibly the most popular logging framework that exists today for Node.js so it’s a good and safe choice to learn.
Getting Started With Winston
The most popular logging framework in the NodeJS community at the moment is Winston. Winston uses the term “transports” to define the destinations for your loggers. To quote the documentation,
“A transport is essentially a storage device for your logs.”
And,
“Each winston logger can have multiple transports configured at different levels.”
Let’s add Winston to our application. First, we need to install Winston by running npm at the command line:

Next, require Winston:
let winston = require('winston');
Then we need to create a logger and configure it:
let logger = winston.createLogger({
    level: 'info',
    format: winston.format.combine(
        winston.format.timestamp(),
        winston.format.printf(info => {
            return `${info.timestamp} ${info.level}: ${info.message}`;
        })
    ),
    transports: [new winston.transport.Console()]
});
What’s happening here?
We’re creating a logger that will log everything above the log level “info.” If you’re unfamiliar with the concept of log levels, be sure to check out our article on log levels.
Next, we’re telling the logger what format to use. In Winston, you can combine formats.
What this means in our example is that logging a message will create an object with a “level” and a “message” property.
The call to “winston.format.timestamp()” will add a “timestamp” property. And the call to “printf” will print out our object in the provided format.
Finally, we added a transport. In this example, we’ll output to the console.
Putting this all together gives us the following code:
let http = require(‘http’);
let winston = require(‘winston’);

let logger = winston.createLogger({
    level: ‘info’,
    format: winston.format.combine(
        winston.format.timestamp(),
        winston.format.printf(info => {
            return `${info.timestamp} ${info.level}: ${info.message}`;
        })
    ),
    transports: [new winston.transports.Console()]
});

http.createServer(onRequest).listen(8080);
function onRequest(request, response) {
    logger.log(‘info’, ‘A request was received’);
    response.writeHead(200);
    response.end();
}
When you run this example and make a request, you’ll see this:

If we also want to log to a file, we just add a second transport:
transports: [
    new winston.transports.Console(),
    new winston.transports.File({filename: 'app.log'})
]
Let’s run the app again and make a request. Now, take a look at the newly created app.log file, and you should see this line:
2020-01-06T19:37:14.015Z info: A request was received
There’s much more we can do with Winston. For example, we can pass in objects, and if we use the correct format, Winston will log a serialized representation of the object.
To do this, we need to add the “splat” format:
format: winston.format.combine(

       winston.format.splat(),

       winston.format.timestamp(),

       winston.format.printf(info => {

           return `${info.timestamp} ${info.level}: ${info.message}`;

       })
This will result in the following log line:

Now, it’s even possible to add metadata to your logs. You can for instance add global metadata, such as a component or service name, to make it easier to search logs when you want to debug a particular problem. To do so, we have to modify the options of the logger object like so:
let winston = require('winston');
let logger = winston.createLogger({
    level: 'info',
    defaultMeta: {
        service: 'user-service'
    },
    format: winston.format.combine(
        winston.format.timestamp(),
        winston.format.printf(info => {
            return ${info.timestamp} ${info.level}: ${info.message};         })     ),     transports: [new winston.transports.Console()] });
Your log output will now start with the metadata you’ve added. For instance, you get a log output like this.
{"service":"user-service","level":"debug","timestamp": 1615405132}
Now, it’s also possible to add metadata to individual requests. Let’s take our callback function called on onRequest. We want to log the request.id for each request.
function onRequest(request, response) {
    logger.log('info', 'A request was received', {
        reqIdD: ${request.id} });     response.writeHead(200);     response.end(); }
Logging in a Library
If you’re writing a library instead of a server application, there’s a slightly different approach to take.
As a library author, you can’t assume your users are using the same logging framework. You also can’t decide where the logs will be sent.
But you still might want to log certain behaviors of your library to help your users investigate potential issues. Having logging from a library can help them identify issues and communicate better in support tickets.
So we can’t use Winston, but we do need to log. In the Node.js community, the aptly named debug package helps us out in this case.
This package allows you to log messages in a library. But the power of choosing which libraries can log is still in the hands of the application authors.
To install it, simply call:
npm install debug
The way debug works, is that you create a debug logger for a specific namespace. Let’s assume our library is called “acme”.
It’s not important what functionality it provides. If we want to create a debug logger in our library, we would use the following code:
const debug = require(“debug”);

const log = debug(“acme”);

log(“This is logging internal to the acme library”);
The users of our library would normally not see this logging. But if they want to, they can enable it by adding the following environment variable:
DEBUG=acme

The nice thing about the debug package is that we can use namespaces. Let’s take our example further and assume our acme package has two major functionalities:
- something regarding customers and
- another part for products.
We could create loggers depending on the functionality we’re currently running in:
const customerLog = debug(“acme:customer”); // for the customer part

const productLog = debug(“acme:product”); // for the product part
If our library users are only interested in the product logs, they could use this environment variable:
DEBUG=acme:product
They would now only see messages from the productLog. They would not see anything from the customerLog.
Take this code as an example:
var debug = require("debug");


var productLogger = debug("acme:product");

var customerLogger = debug("acme:customer");


productLogger("Product added: Scalyr Log Management");

productLogger("Product edited: Scalyr Log Management");

customerLogger("Customer registered");

customerLogger("Product added to shopping cart: Scalyr Log Management");

productLogger("Product edited: Scalyr Log Management")

customerLogger("Payment received");
With the “DEBUG=acme:product” environment variable, this would yield the following results:
Debug is powerful in this regard. If they want to see everything from our library, users could use “acme:*”:
If there are other libraries they want to inspect, a comma-separated list will do. For example, this environment variable will show everything from acme, and the logs from the Express router:
DEBUG=acme:*,express:router:*
Remember to provide the users of your library with some documentation of the different debug namespaces that you’re using. This will make it easier for them to select the correct namespace.
What to Do Now?
We’ve now used Winston to perform some basic logging and have seen how the debug package can be used in libraries.
Our logging is currently still very basic. But the power of a logging framework like Winston lies in how configurable it is.
You could easily configure it to write everything to a log file but have errors mailed to you. You can also write your own transport if none of the built-in ones work for you.

But be sure to search npm first, because many custom transports have already been written for Winston.
What you should do now is add logging to your application and configure it as you go. Think about a sensible starting point for now, but change it as you encounter new requirements and possibilities.
Experiment with formats, transports, and log levels. Definitely read the documentation because there’s more to Winston than what I’ve mentioned here.
There’s also more to logging than what we’ve covered in this article. As the title suggests, this is just a starting point.
In the past, we’ve written about best practices in logging and also about practices you should avoid. And once you’re used to logging (and reading logs), you’ll want to move on and look into log aggregation and management.
Speaking of log management, once you get your logging strategy up and running, you’ll need a proper log management solution. A platform like Scalyr’s offering can help you centralize your logs from a broad variety of sources into a single place. You can then process them to obtain priceless knowledge that would’ve been lost otherwise. Give Scalyr a try today.


