Sales, pre-sales, human resources, the company cafeteria: they’re all online. If the network is down, employees are angry and customers have gone elsewhere.
That’s why network traffic monitoring is a critical part of maintaining a healthy enterprise. In other words: by monitoring what goes through your network, you increase the chance of detecting and fixing issues. Therefore, network traffic monitoring prevents network downtime. However, as you’ll soon see, there’s more to it than that.
This post is about network traffic monitoring as a concept. Moreover, it also covers the tools you should be aware of. Firstly, we’ll cover how to proactively watch systems, and why it’s important.
After that, we’ll also review a list of the best tools available to monitor your network traffic. That way, you can find the system that best suits your individual needs.

Why Network Traffic Monitoring?
Fixing network problems when they happen isn’t good enough. IT managers have to proactively watch systems. They have to prevent potential issues before they occur.
In other words, this means observing network traffic. It also includes measuring utilization, availability, and performance.
Therefore, a useful monitoring tool offers these features:
- real-time network monitoring
- an ability to detect outages in real time
- a mechanism for sending alerts
- integrations for network hardware, such as SNMP and NetFlow monitoring
Available Tools
This is a list of the best tools for monitoring your network traffic. Several of them are sold as SaaS. Others are sold for running on-premises. Also, a couple of them are open-source with optional commercial versions.
All of these tools offer more than just network monitoring. For instance, they also offer varying degrees of system, web, and application performance monitoring too.
Also, bear in mind that the tools are listed in no particular order.
Monitis
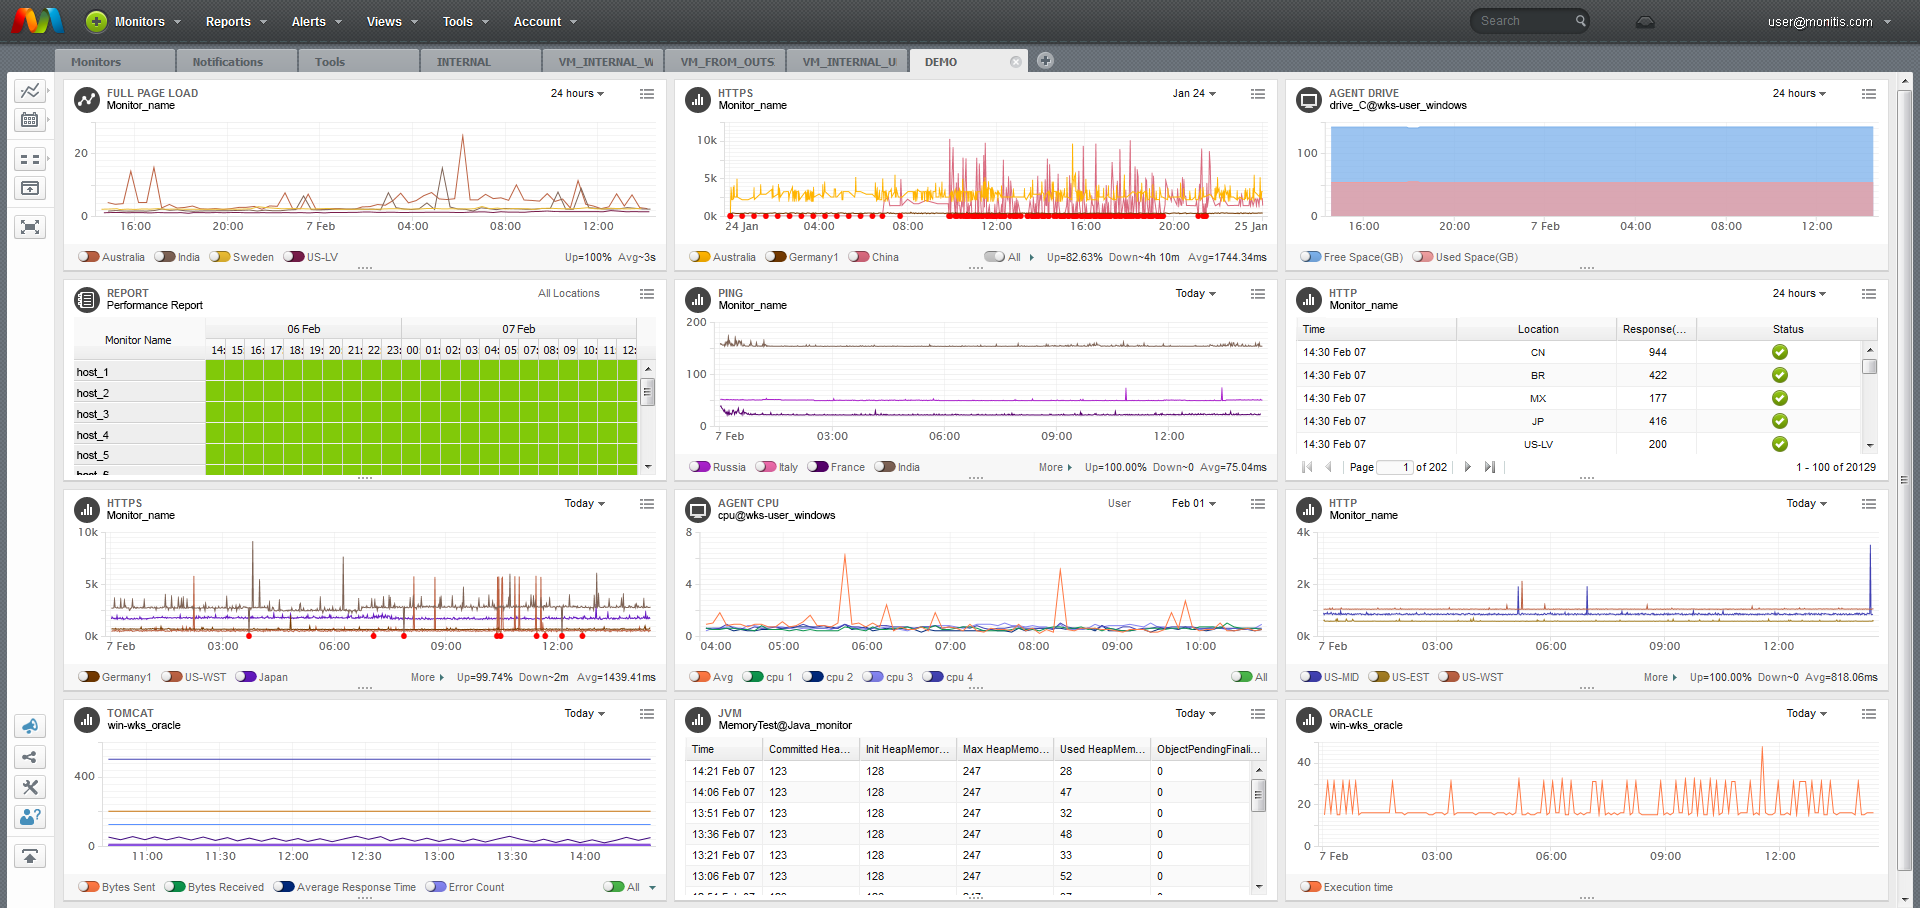
Monitis is a SaaS offering that has been around for more than a decade. You can get your network traffic monitoring up and running with it in minutes.
In addition, Monitis also offers custom plans. Those are based on the number of nodes in your network and the type of monitoring you desire. The system supports agent-based and agentless monitoring of a wide variety of devices.
Monitis supports SNMP too. Also, it offers users:
- a browser-based management console
- monitoring for users, websites, servers, applications, and networks
- 30+ locations around the world for running availability checks
- Detailed reporting based on preset and custom date ranges on up to two years of data
Monitis will send alerts via several channels. For instance:
- SMS
- telephone
- Google Talk
In addition, Monitis can also post alerts to a web URL that you define.
It also integrates with Pager Duty. Except for Spiceworks Network Monitor, Monitis is the most basic tool on this list.
ManageEngine OpManager
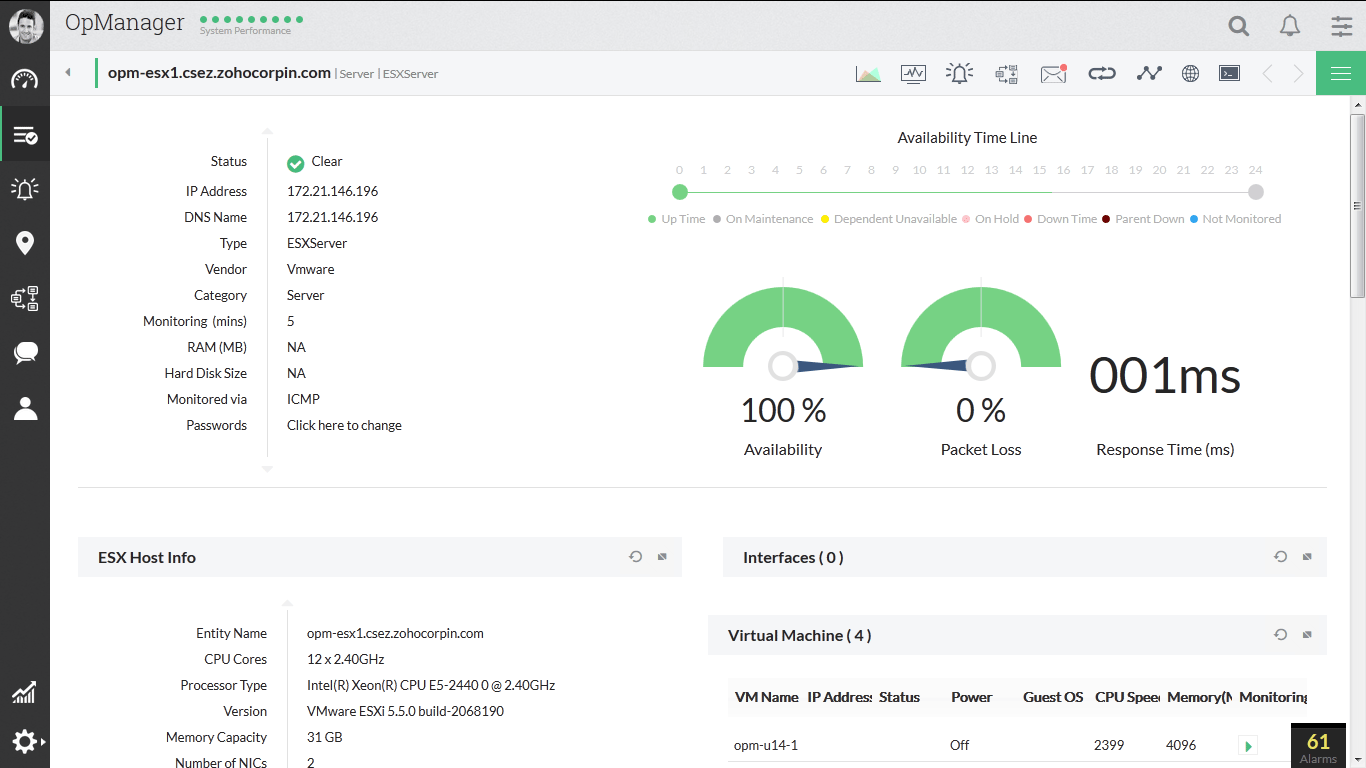
OpManager is a software application that runs on-premises. OpManager is a fully-featured monitoring platform. However, it has a strong emphasis on network traffic monitoring.
Ops Manager has explicit support for real-time monitoring, threshold-based alerts, and a built-in set of troubleshooting tools. It can send alerts via email and SMS.
Some key features in OpManager are the following:
- correlating related events in the management console to detect patterns
- highly customizable management interface
- real-time network graphing for statistics such as bandwidth utilization on network ports
- built-in network tools such as ICMP ping and traceroute that simplify the process of troubleshooting problems
- complete SNMP integration
OpManager is a complete network management tool. It boasts a client list that includes NASA, DHL, and AT&T.
A trial version is available for download. Licensing is based on the number of nodes you want to monitor.
Zabbix
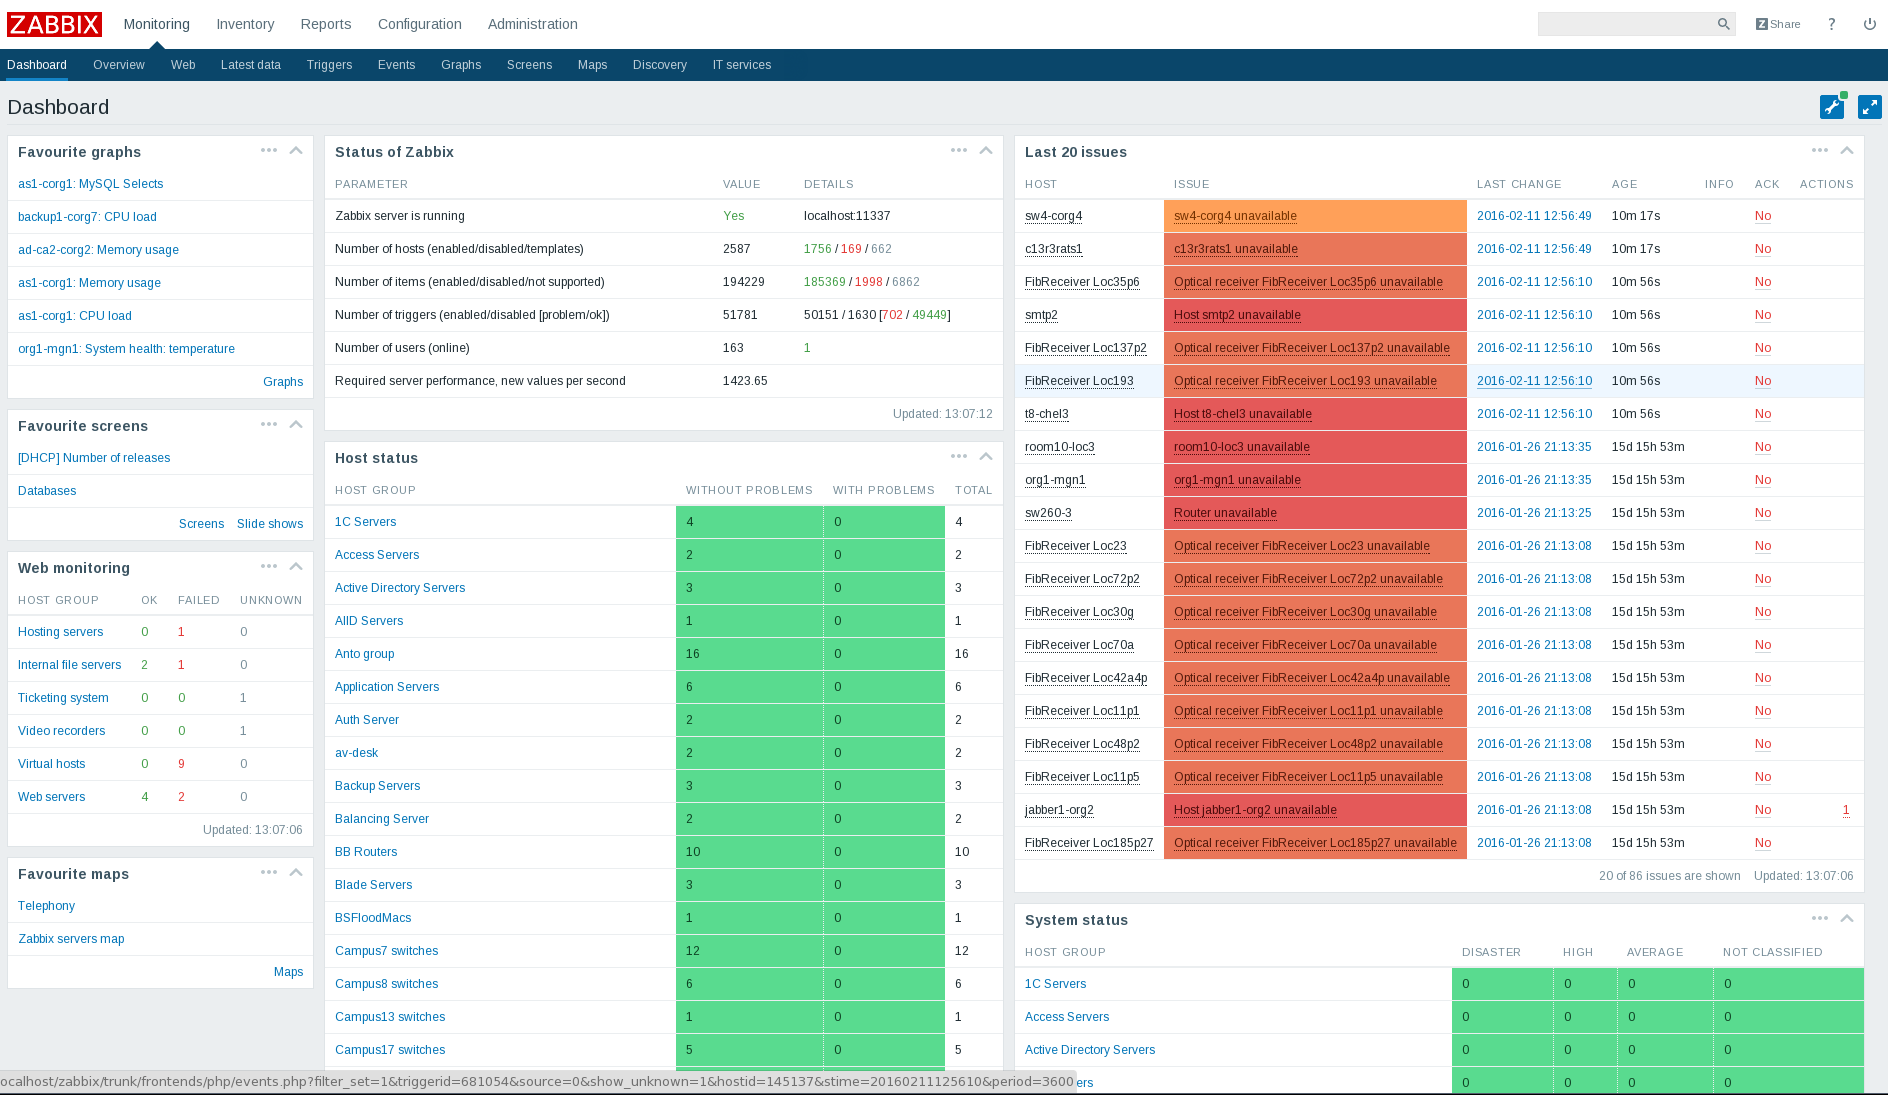
Zabbix is an open-source monitoring platform. It comes with a complete set of networking traffic monitoring features. You can download it and install it yourself. Alternatively, you can purchase consulting support, or buy a turnkey solution.
Zabbix has broad community support with extensive online documentation. In addition, it also has an extensive collection of plug-and-play “templates” for network hardware.
The templates support major vendors like Cisco, Brocade, Netgear, and HP. Among Zabbix’s major networking features are:
- active and passive scanning of network hardware and servers
- automatic detection of new devices and configuration changes
- tools for building predictive functions based on historical data
- full SNMP integration with templates for conventional network equipment
A version of Zabbix for the cloud is in beta.
Logic Monitor
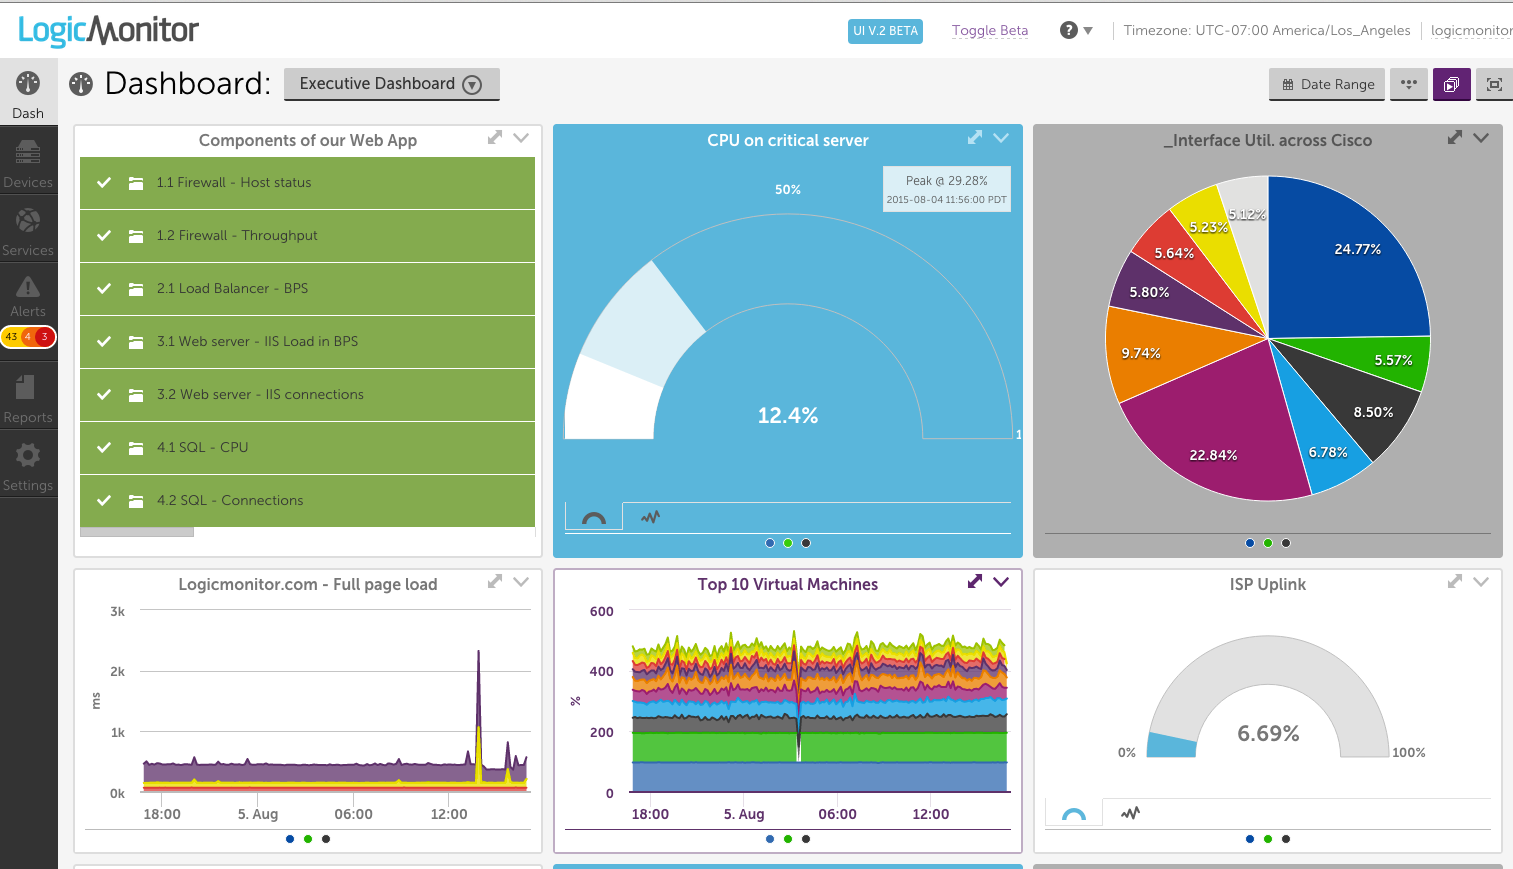
LogicMonitor is another SaaS offering. It’s a complete solution for system and network monitoring.
LogicMonitor has an extensive list of integrations. For instance, Slack and Pager Duty for messaging. The system can alert your team using email, SMS, and its integrated messaging system.
Logic Monitor includes these features:
- interface metrics, such as throughput, error rates, and utilization statistics
- automatic discovery of network devices and interfaces
- profiles for monitoring VOIP, QOS settings, and wireless access points
- predictive alerting and trend analysis
- SNMP integration
Logic Monitor is sold in three licensing tiers. Therefore, so you can customize your system to your network size.
Nagios and Nagios XI
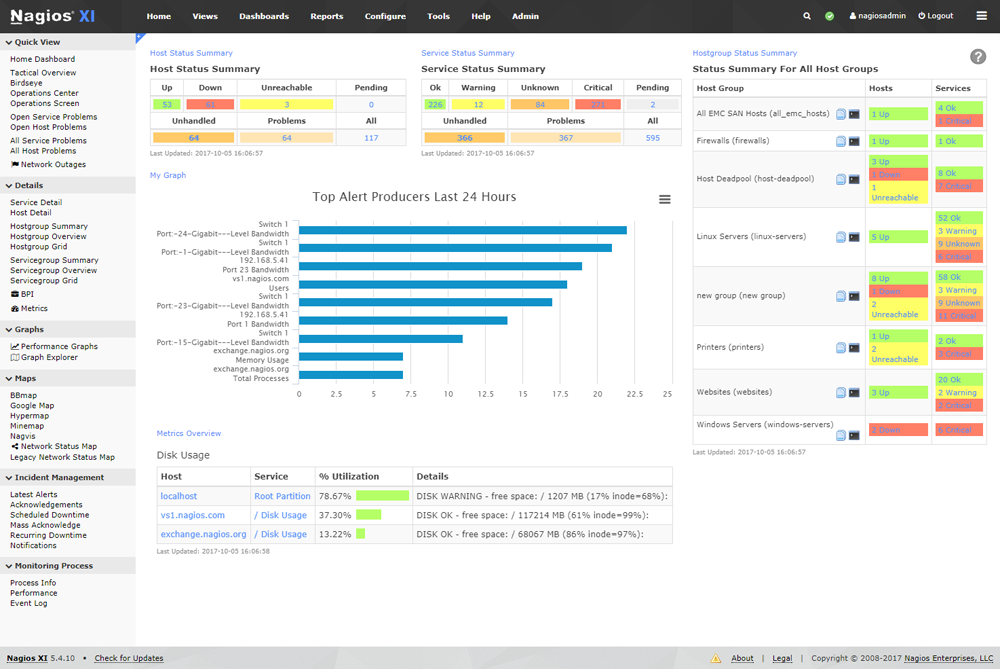
Nagios is another open-source project. It’s available both as a free or a supported product.
The open-source project is called Nagios Core. It is a platform you can configure using open-source plugins. These plugins cover thousands of network traffic monitoring situations.

On the other hand, Nagios XI is a commercial fork of the open-source project. It’s available as a licensed application with a variety of support options. Most importantly, both the open source and commercial variants applications run on-premises.
There are differences between the two versions. For instance, Nagios XI has a network analyzer package with features specific to network traffic monitoring. On the other hand, Nagios provides:
- monitoring of network services
- a browser-based management console
- a simple plugin for custom service checks
- Alerts via email, SMS, and user-defined scripts.
- the ability to define event handlers to be run during service or host events for proactive problem resolution
- extensive device support via SNMP
Paessler PRTG

PRTG Network Monitor is an application that is available as both a download or a hosted application. It runs on a Windows server. However, it can be viewed from any browser. in addition, it can be viewed on Android and IOS apps.
PRTG will send notifications to many destinations. Those include:
- SMS
- push notifications to their mobile apps
- Amazon SNS events.
In addition, Paessler has impressive online documentation on their site.
PRTG network monitor offers:
- network traffic monitoring
- in-depth reporting features
- a customizable network map
- SNMP management and monitoring
Paessler licenses PRTG Network Monitor on a per-node business. In addition, Paessler also offers a collection of freeware monitoring tools.
WhatsUp Gold
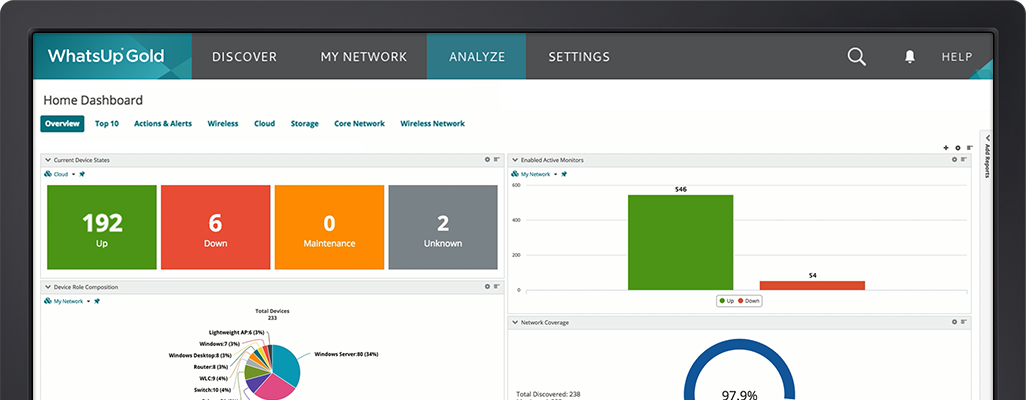
Ipswitch’s WhatsUp Gold is an on-premise networking monitoring solution. It provides status and statistics for network devices, servers, storage, and wireless access points.
In addition, it has an add-on for network traffic analysis. It provides data about bandwidth utilization for individual devices.
WhatsUp Gold can send alerts via SMS, Slack, email, and application alarms. Moreover, it has a comprehensive list of features, including:
- automated network discovery
- customizable dashboards
- network traffic analysis
- SNMP integration
WhatsUp Gold is licensed based on the number of nodes you wish to monitor.
Spiceworks Network Monitor
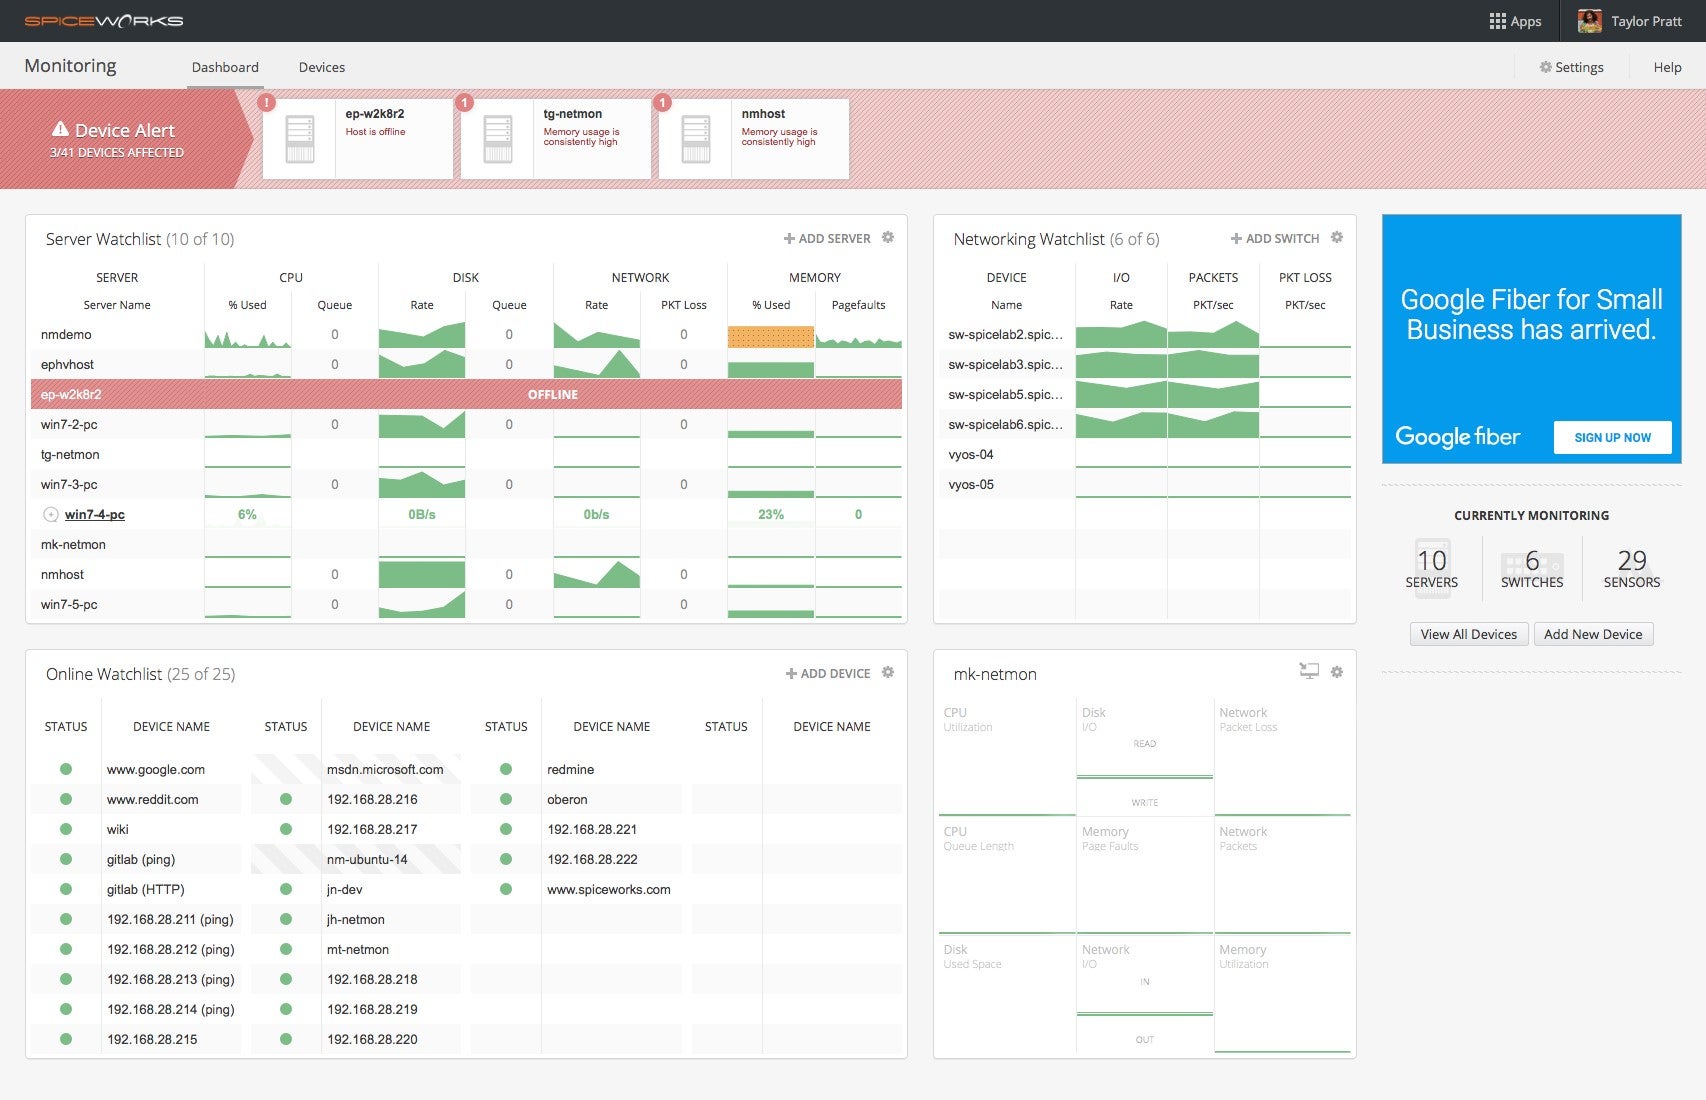
Spiceworks Network Monitor is a free tool. It’s available for Windows and Linux. It offers basic monitoring capabilities via SNMP versions one and two.
Spiceworks works well with more network hardware. However, it has sponsored advertisements, since it’s free. Spiceworks Network Monitor sends alerts via email. In addition, it can alert you inside the application as well.
In conclusion, we can say Spiceworks is a basic network monitoring application. Its main features are:
- real-time monitoring for servers, switches, and any IP device that support SNMP
- support for up to 25 devices
- very easy installation and configuration procedures
Conclusion
Selecting a network traffic monitoring tool requires thought. You’ll find that there are many good tools available. More importantly, each of them has its strengths and weaknesses.
The good news is the best have free trials. In addition, they also have good online documentation. So, use that to your advantage. Find the tool that best suits your individual needs.
(And remember: it doesn’t matter how you monitor your network traffic. You can always incorporate it as a Scalyr data source).
Speaking of which: don’t you use Scalyr? Then, we invite you to give it a try today.


