In his book “How to Measure Anything,” management consultant and author Douglas Hubbard states that “anything can be measured.” Hubbard argues that something that can be observed lends itself to being measured.
How can this apply to software development and operations?
Well, in today’s world of increasingly complex IT systems, you can’t afford not to measure anything and everything. But in order to observe and then measure something, it needs to meet the literal definition of observability, meaning that a system’s internal state must be exposed externally. This allows you to measure it.
With observability, you find out not only that your system malfunctioned, but also why. This is done with data from logs, metrics, and traces.
In 2011, the Etsy Engineering team made things a little bit easier to measure and observe metrics in your IT system with the introduction of StatsD. Historically, collecting data about networks and servers has always been easier to do than gaining the same information about applications.
StatsD made collecting application metrics simpler for developers by instrumenting your code with specific metrics you want to observe. As a result, StatsD has become one of the most popular tools for gathering metrics data.
In this post, I’m going to give you a brief tutorial of StatsD and how you can use it to measure anything in your application.

What’s This StatsD You Speak Of?
StatsD is a network daemon released by Etsy and written in Node.js to collect, aggregate, and send developer-defined application metrics to a separate system for graphical analysis. Initially, the daemon’s job was to listen on a UDP port for incoming metrics data, parse and extract this information, and periodically send this data to Graphite in an aggregated format.
One big goal of StatsD is to collect data quickly. The better transport protocol for this is UDP. With UDP, the StatsD client can just send the metrics data and assume that it will get to the daemon, especially if it’s on the same instance.

What It’s Made Of
The StatsD architecture consists of three main components: client, server, and backend.
The client implementation contains the libraries for the specific language you’re using for your application. With StatsD’s increased popularity, there’s now support for multiple languages. With the appropriate client library, you can instrument your software code with any metrics you want to track, in almost any way you want to track them.

The server implementation includes a daemon that listens for UDP traffic coming from the client libraries. It then aggregates all their data and flushes everything to the backend system. By default, this happens every 10 seconds, which effectively means that metrics are collected in real time.
The backend component, which now includes more than Graphite, is where all of the metrics data will reside for graphing and analysis. The StatsD daemon will utilize what’s often an HTTP-based connection to send the aggregated data to some other system. This could be something installed on the same instance, but it’s more often another monitoring or logging solution that’s external to the client and server implementations.
But there are times when you can’t install the client and server daemon on the same instance. Or, you simply want assurance that the collected data gets delivered. It could also be that you’re in an environment that denies or restricts UDP traffic.
In that case, you have the option to implement the TCP protocol instead of UDP. Because of TCP’s connection-oriented nature, StatsD won’t collect data as quickly, but if deliverability due to packet loss is a concern, you can enable TCP in the server configuration.
Why Use StatsD?
There are a number of tools out there you can use to collect application metrics. What is it that sets StatsD apart from other tools? And why would you want to use it?
StatsD offers a couple of reasons why:
- Open source. Many of the more well-known monitoring and observability tools are commercial products. Because StatsD is open source, you can just start using it to test it for your applications and see how it goes. No purchase process or anything like that deal with.
- Control. With StatsD, you have total control over what and how you collect metrics. You can send all the data or a sampling of that data. It’s your choice. You don’t get that with most commercial tools, and even some open source tools.
- Modularity. You don’t have to be tied to any one platform because of what your app is written in. The components are modular. An app written in Python can send data to server daemon written in Python or something completely different. Changes you make on the client side don’t have to affect the server or backend, unless you want.
How Metrics Are Formatted
The basic metrics data that the StatsD client sends contains three things: a metric name, its value, and a metric type. This data is formatted this way:
<metric_name>:<metric_value>|<metric_type>
- Metric name (also called a bucket) is pretty self-explanatory. One key thing to remember is to name your metric in a way that aims to avoid confusion or misinterpretation later.
- Metric value is the number associated with that metric’s performance at collection time. The actual value will depend on the type of metric which you are collecting data for.
- Metric type defines what type of data the metric actually represents. StatsD supports several metric types, including counters, gauges, timers, and sets.
A counter metric type is a count the number of times a particular event occurred in your application. This type is incremented each time it happens, and sends both the total count and the count rate, over the flush interval. An example could be the number of times users logged in:
page.login.users:1|c
A timer metric type is the amount of time, in milliseconds, it takes a request to finish. An example could be how long it takes for a login page to load:
page.login.time:350|ms
Why Sampling Measures More
In a production environment, your application’s likely very busy. If you find that StatsD is collecting a lot of the metrics you want to include, then you should utilize an extended metric format to send your data.
This includes allowing the StatsD client to collect a sampling of the metrics data by percentage and send that information to the server. So to collect data for only 50% of the time, you would specify 0.5 as your sampling rate.
The server will multiply that number by the inverse of the sampling rate you specified and send this new number to your backend. The metric format for the sampling rate is:
<metric_name>:<metric_value>|<metric_type>|@<sampling_rate>
An example of the number of users logging in could be:
page.login.users:10|c|@0.5
How to Collect Data
Now that you’ve learned the basics about StatsD, let’s go through some of the steps to start collecting data. We’ll install and configure it to start sending data.
Installing and Configuring StatsD
Installing the StatsD daemon starts by first installing Node.js. Other server implementations are also supported. I’m using Ubuntu in this example. Adjust your commands appropriately if you’re using another distro.
sudo apt-get install -y nodejs
Once you have Node.js installed, you need to get the StatsD package where it resides, which is currently on GitHub. You will need to clone the package to run it on your machine.
If you don’t already have git on your machine, run:
sudo apt-get install -y git
Next, clone the repo:
git clone https://github.com/statsd/statsd.git
Now, let’s go to the StatsD config file to specify where our server and backend will run.
StatsD comes with an example file with the config data in it. Let’s make a copy of that:
cd statsdsudo cp exampleConfig.js localConfig.js
Open the config file and make the necessary changes:
sudo nano localConfig.js
With that file open, make sure to scroll down to the bottom. What you’re looking for is something that looks like this:
{
  graphitePort: 2003
, graphiteHost: "graphite.example.com"
, port: 8125
, backends: [ "./backends/graphite" ]
}
This config is telling us that the daemon is listening on UDP port 8125 for messages from the client. The default server IP is 0.0.0.0.
It’s also specifying Graphite as your backend, but you may decide to use another system. For this test, comment out Graphite and add “console” as your backend. You should have this:
{
/*  graphitePort: 2003
, graphiteHost: "graphite.example.com"
,*/ port: 8125
, backends: [ "./backends/console" ]
}
Now save and close your config file.
Finally, start the StatsD server, making sure you’re still in the /statsd directory:
node stats.js localConfig.js
If all worked well, you should see StatsD running:

Get the Metrics Out
Now that you have the StatsD daemon configured and running, the next step is to send some metrics data.
Sending data requires instrumenting your code. There are numerous client implementations of StatsD that can allow you to do this task.
For the purposes of this tutorial, you’re going to send some data to the console.
So let’s try running the following command to send data:
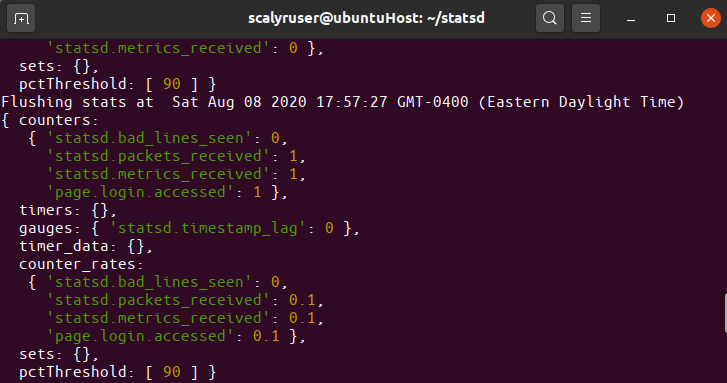
echo “page.login.accessed:1|c” | nc -u -w 1 127.0.0.1 8125
This command will send to the StatsD server a metric called “page.login.accessed” with a value of 1 and counting metric type. If run successfully, you should be able to see the data in your console where you have the StatsD daemon running.

Making Sense of the Data
Now that you have StatsD sending data to the daemon, the server will collect and aggregate the metrics data and forward them to the backend system. In our test, we sent data to the console backend.
In the monitoring backend, depending on your preferred system, you’re able to view all of the data from your application in graphical form. You’ll be able to search for the metrics that you’re sending and create dashboards in ways you want to view the data.
Because of the client-server-backend model with StatsD, you don’t have to be locked into using one backend. If you ever need to change, you simply add your backend to the /backends directory, go to the localConfig.js file, and update the backends variable.
One of those backends you can add is Scalyr. The Scalyr agent can act as your Graphite backend, and relay all of the collected data over to the Scalyr service. All you would need is Scalyr’s Graphite Monitor agent plugin and you’re on your way. Try Scalyr with your StatsD implementation now.
Don’t Be Wrong
Instrumenting your application code with specific metrics you care about will help you identify potential problems not just in development, but also when your application goes into production. While StatsD makes it simple to do, application instrumentation may be the most complicated piece. But the ability to measure anything can be invaluable.
If it’s that important, you should take the time to define the custom metrics you want to measure. If there’s something uncertain about your application, you have a chance of being wrong.
So the lesson is: don’t be wrong. Measuring the performance of your application using StatsD will prove or disprove any thoughts or ideas you have about how your application actually performs in production.
And that’s why you measure anything and everything.


