We’re living in an incredible time for tech because everything we do online generates large amounts of data, starting from our browser history that’s then recorded in the web server logs behind every website we visit. In addition to this, our computers store dozens, if not hundreds, of cookies. Each of them records specific information, such as pages you see, ads clicked, or topics you search for. All this data is saved in a database—probably more than one—for further processing.
There’s also another kind of data we can and should take advantage of. We can collect usage logs for every application we use. Additionally, we can generate development metrics to improve the development process. We can also analyze data to keep an eye on the health of our production environments.
For all described tasks, and many more, Grafana has a plugin the can help you. In this post, I’ll showcase some Grafana plugins that you may find very useful to your specific needs. Let’s take a look at them, classified by their type.

Panel Plugins
As stated on the Grafana site, panel plugins allow new data visualizations to be added to Grafana, for both time series and non-time series data.
Table Panel
The Table Panel plugin comes with Grafana, and it provides a table implementation. There are some features such as aggregation, paging, row coloring, and data filtering that make for an easy data visualization. Here’s an example from the Grafana playground:
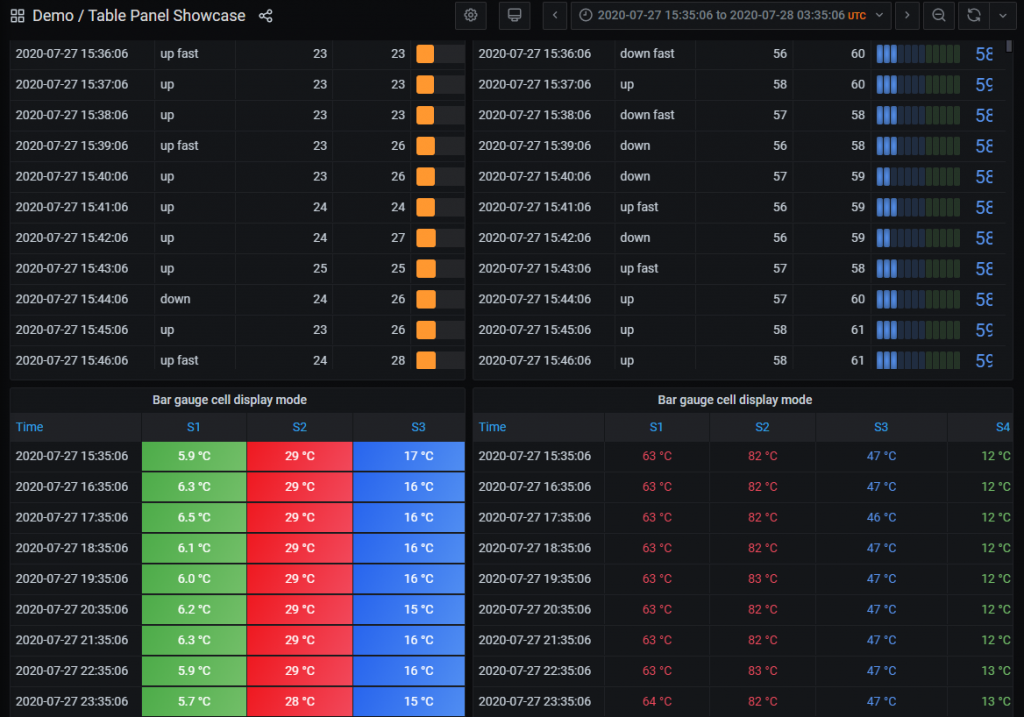
Why do I consider this plugin useful? Well, it’s because of the ability to view raw data. When you think about it, graphics and charts are a great way to see the big picture. You can observe a chart and immediately see high and low points. Additionally, another graphic will show data as trends.
However, sometimes you need to see the specific values behind those lows and highs. Those values may be the keys to completely understanding the graphic’s behavior.
With this plugin, you can set up the way you want to see your metrics or your records. There are some other tables plugins, but since this one is already integrated, you just need to configure it to your needs.

Graph Panel
Another plugin that is already included with Grafana is the Graph Panel plugin. Here’s another example from the Grafana website:
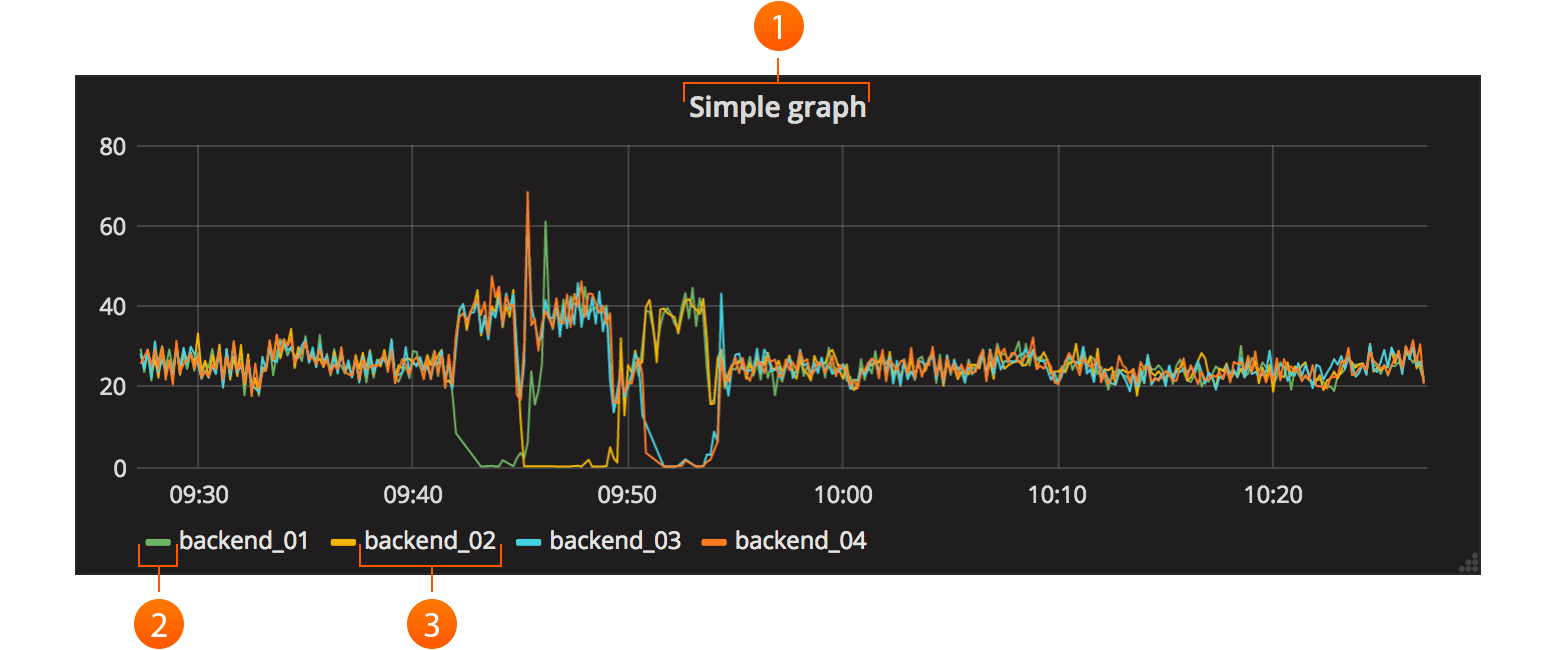
This plugin has three main draw options: bars, lines, and points. You can select what data series to render. Depending on the data source, you’ll see different options.
The axes allow you to configure them in different ways. For the x-axis, there are time, series, and histogram modes. Each of them allows you to aggregate your data accordingly.
For the y-axis, you’re able to set up units, scale, and min and max values, among other options. There are also visibility settings for both axes.
On the latest version, you’re also able to link the data to a specific URL or to another dashboard. In the end, there are many options to play around with in order to get the best visualization from your data. Also, this is the base for creating other dashboards.
I have two reasons for considering this plugin useful. The first is that, as mentioned above, it’s already included with Grafana, so you don’t have to worry about how to install it. The second reason is it’s the base for many other panel and application plugins. Should you create your own plugin, you can use this for setting up your custom graphics.
Data Source Plugins
Data source plugins allow you to extend Grafana to connect to different databases and online sources.
For example, these plugins support the following databases: MySQL, PostgreSQL, Azure Data Explorer, InfluxDB, Google BigQuery, and Oracle. According to the site, there are over 30 data sources to choose from. Let me show you a couple of interesting data source plugins.
Scalyr
Scalyr is a log management tool designed to integrate itself into the development workflow. It enables you to visualize different metrics, create alerts, and perform data queries, among other features.
Recently, Scalyr released a plugin for Grafana, enabling you to visualize its data through the Grafana platform.
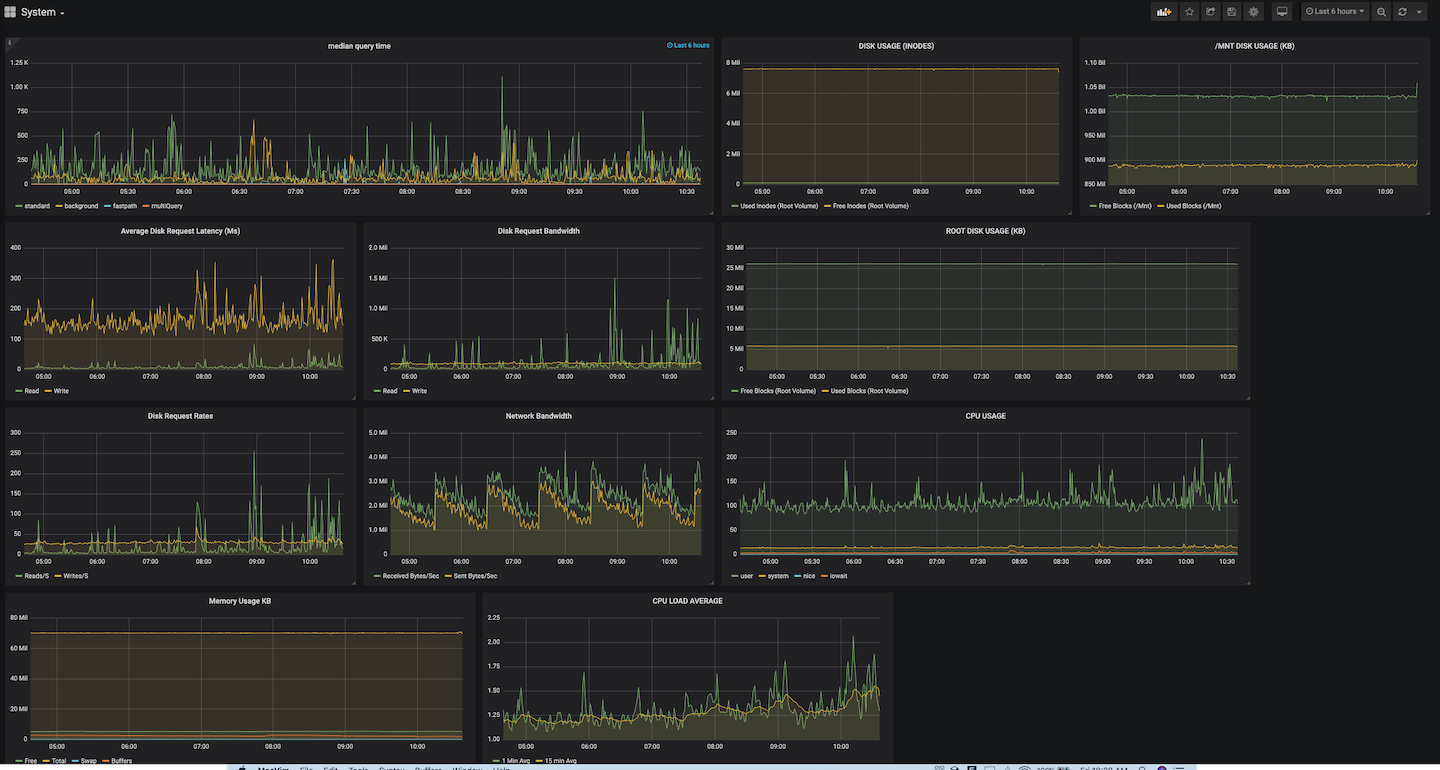
With Scalyr, you can extend your data sources even more and take advantage of its data processing capabilities. It’s worth taking note that some sources include unstructured data, making it ready to be analyzed.
Why consider it? Grafana can display data from many data sources, but each one of them corresponds to a single product or set of products. Scalyr, on the other hand, gets data from sources that may not be included with Grafana. As a consequence, you’re able to unify all your data sources in a single display platform. Finally, you’re able to get the most value from both services.
Wanna try? take a look by yourself by using Scaly’s free trial.
AppDynamics
If you have systems using Java, you’ll be familiar with the information the AppDynamics platform provides.
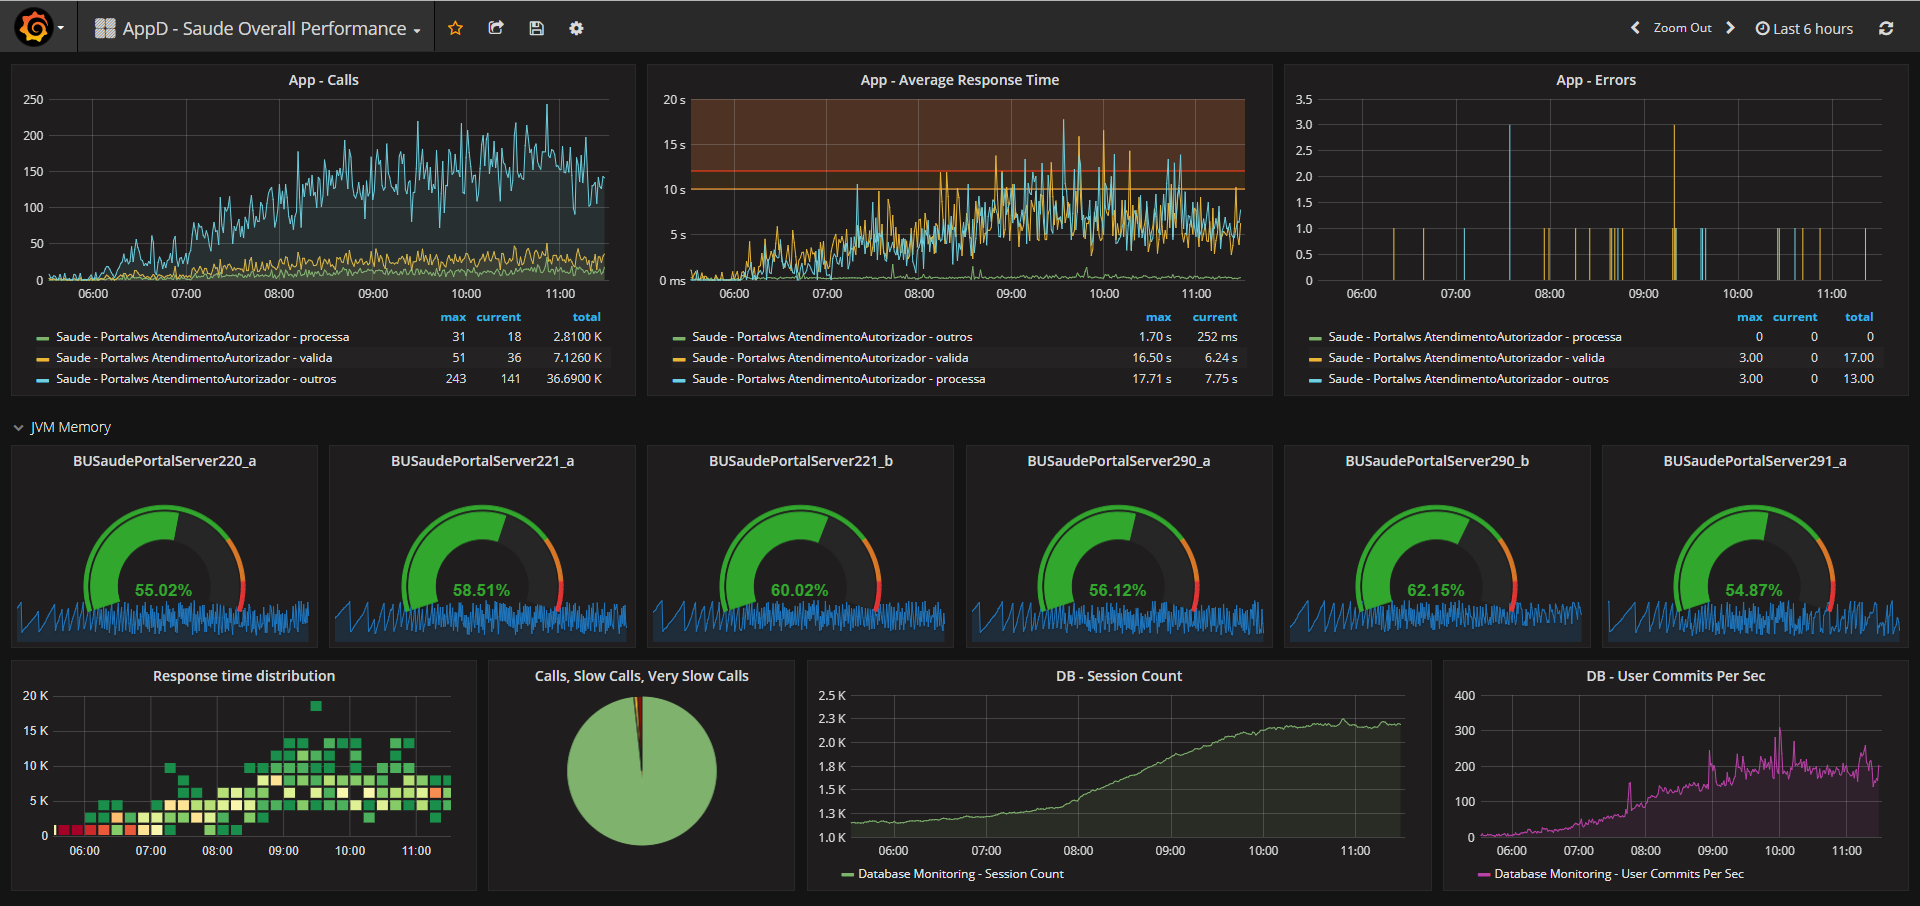
With a very simple setup, you can start visualizing all the metrics related to your application performance. As you can see in the image above, you’ll find it easier to see the amount of API calls, response times, and errors. You can also monitor your Java virtual machine (JVM) memory usage for all your nodes.
Additionally, you can see how many database sessions are open at a given time and even how many commits your application is doing per second. All this information can help you find bottlenecks, especially if your application is heavily used, and other points where you can improve. It can even point out an issue outside your code, such as database issues performing below expectations.
Why consider this plugin? When you use Java in production, it’s very important to keep an eye on your application performance. Consequently, this plugin allows you to take advantage of the AppDynamics data and consolidate it with a single monitoring and analytics platform.
CloudWatch
CloudWatch is a monitoring service. As stated on the Amazon website, it provides data and insights to monitor applications, optimize resource utilization, and, in general, get a unified view of operational health. Sure, Amazon has its own platform for monitoring its services. But, when you also have services running outside Amazon, it’s good to have a platform that can get data from all the services you use.
Grafana has built-in support for CloudWatch, and with this plugin, you’ll be able to build dashboards to monitor your CloudWatch metrics.
Grafana uses the Amazon authentication and identification management (AIM) in the back end to connect to the CloudWatch service. If you have Grafana running already in Amazon Web Services (AWS), authentication is handled automatically.
Afterward, you can make queries to view metrics data. Take this image as an example:
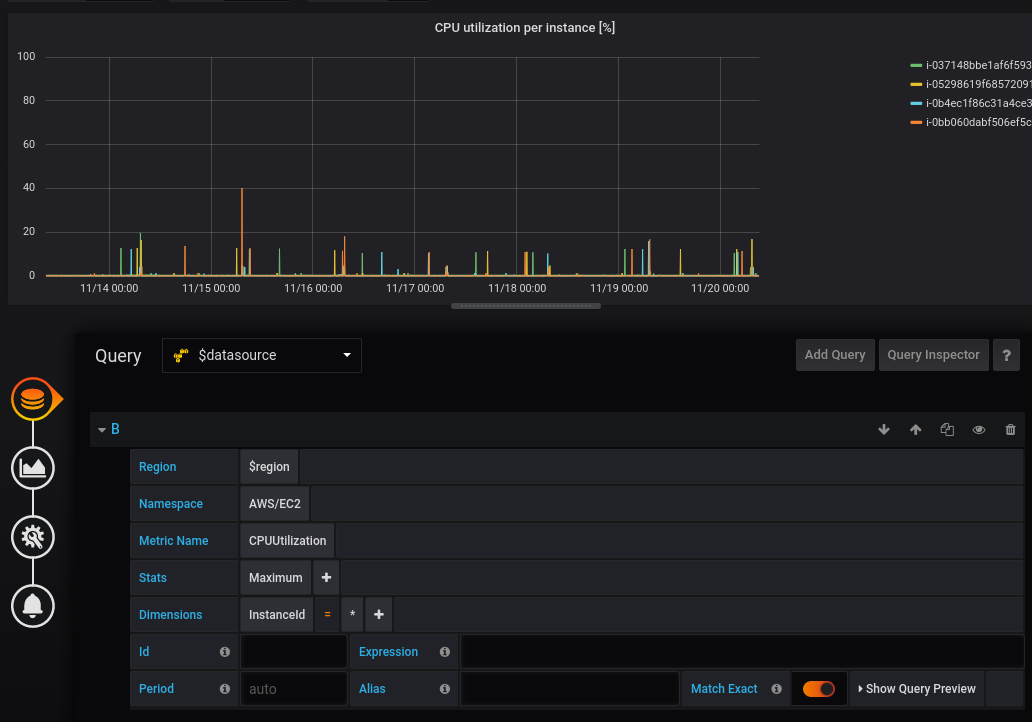
This data source includes dashboards for the following services:
- Amazon Elastic Compute Cloud (Amazon EC2)
- Amazon Elastic Block Store (Amazon EBS)
- AWS Lambda
- Amazon CloudWatch Logs
- Amazon Relational Database Service (Amazon RDS)
The utility of this plugin relies on the possibility of integrating AWS with non-AWS and data sources, thus having all monitoring in a single platform. Additionally, data will be easier to analyze and correlate.
App Plugins
Apps are bundles of panels, data sources, dashboards, and new UI pages. They’re a mix of the other two types of plugins. Let’s explore some of the advanced plugins available.
Kubernetes
Kubernetes (K8s) is an open-source system for automating deployment, scaling, and management of containerized applications. Sometimes it’s hard to manage this platform. So, if it’s easy to monitor a container’s status and overall cluster health, it’s easy to manage the cluster resources and tune them accordingly.
As one of its features, this plugin uses tags to filter pod metrics, to make it easy to find relevant pods. In the next image, we can see some of the metrics displayed by container.
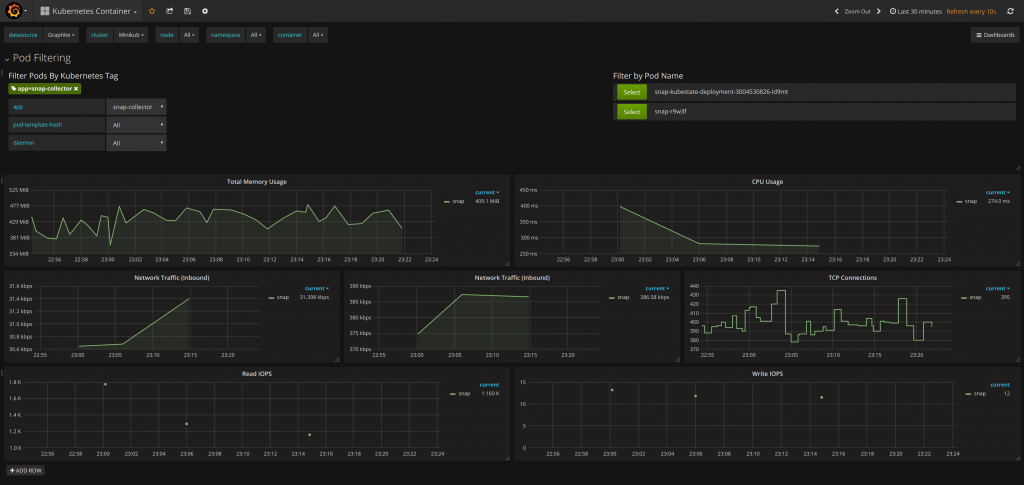
Some of the metrics that you can see above include total memory usage, CPU usage, network traffic, and read and write IOPS. Additionally, these same metrics are available at the node level.
As you can see, the built-in dashboards already provide most of the information needed. In the end, we can have a better view of the cluster health.
Why pick this plugin up? Because with the information it provides, it makes a complex platform easier to monitor, and, consequently, easier to manage.
Kentik Connect Pro
Kentic is a platform that helps you to to handle network data. Now, more than ever, we depend on a healthy network to be able to perform out daily jobs, and a good visualization goes a long way helping troubleshoot network related issues.
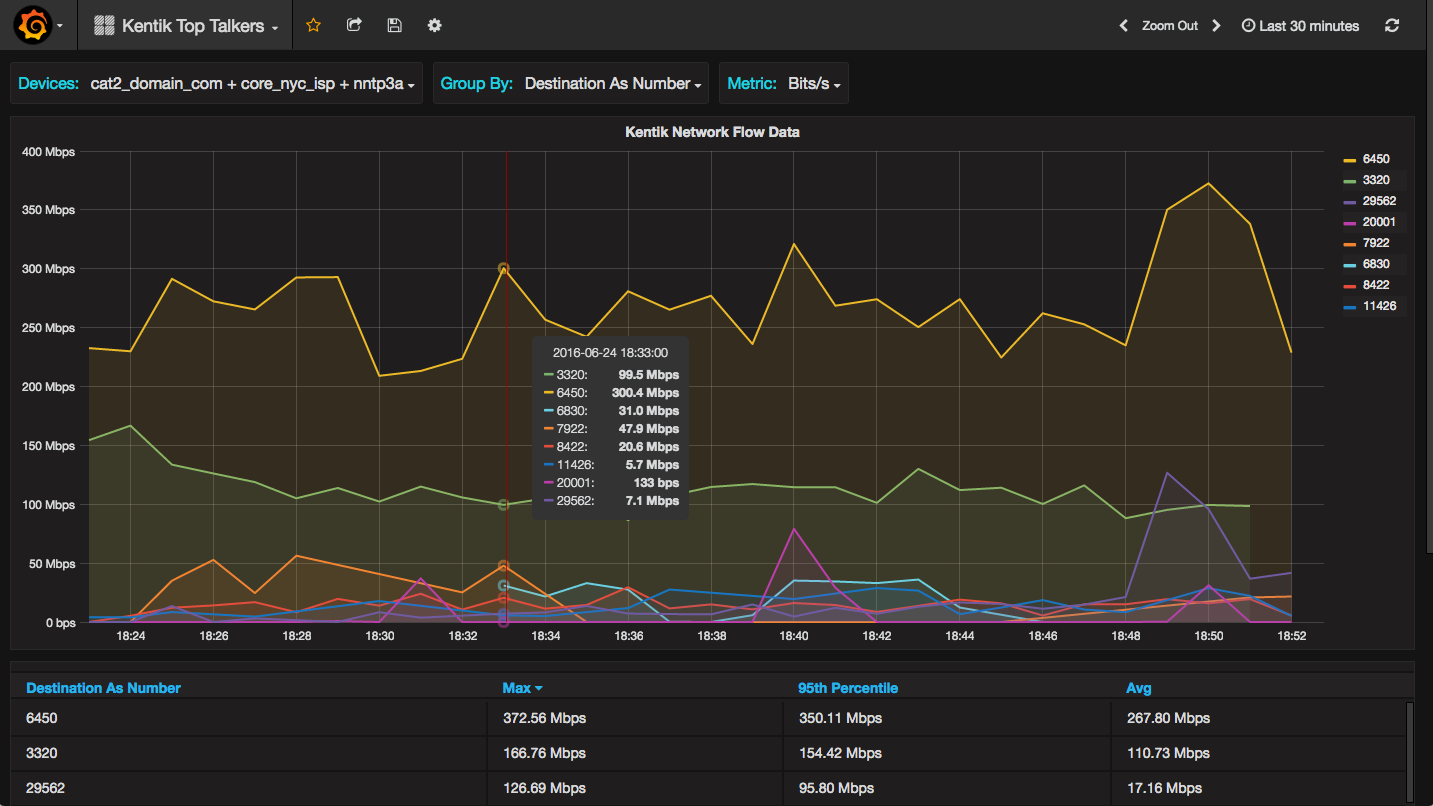
On the image above you can see different network speeds by device and time at a specific timeframe, as well as some other data as max speed, average and 95th percentile. It is a simple example of the kind of information you can see. Also, see how quickly you find an issue in your network and start working on it before your customers even start noticing.
Features include custom timespan range, multiple devices, dimensions for over 30 source and destinations, different metrics and sorting.
My reason to select this plugin on the list is because you can improve customer satisfaction, and have a broader view of your network infrastructure.

What’s Next
I’ve described only a portion of what’s available in the repository of Grafana plugins. There are more panels, more data sources, and more applications. However, I consider these Grafana plugins useful because they highlight Grafana’s capabilities in terms of data visualization, data sources options, and integration with other systems.
Grafana is an open platform, so you’re able to contribute with your own plugins. However, not all of them are freely available. You’ll require an enterprise license for some and a license to use additional data sources. The advantage is that you’ll have a uniform platform to monitor your resources and to visualize any kind of data source you may have.


