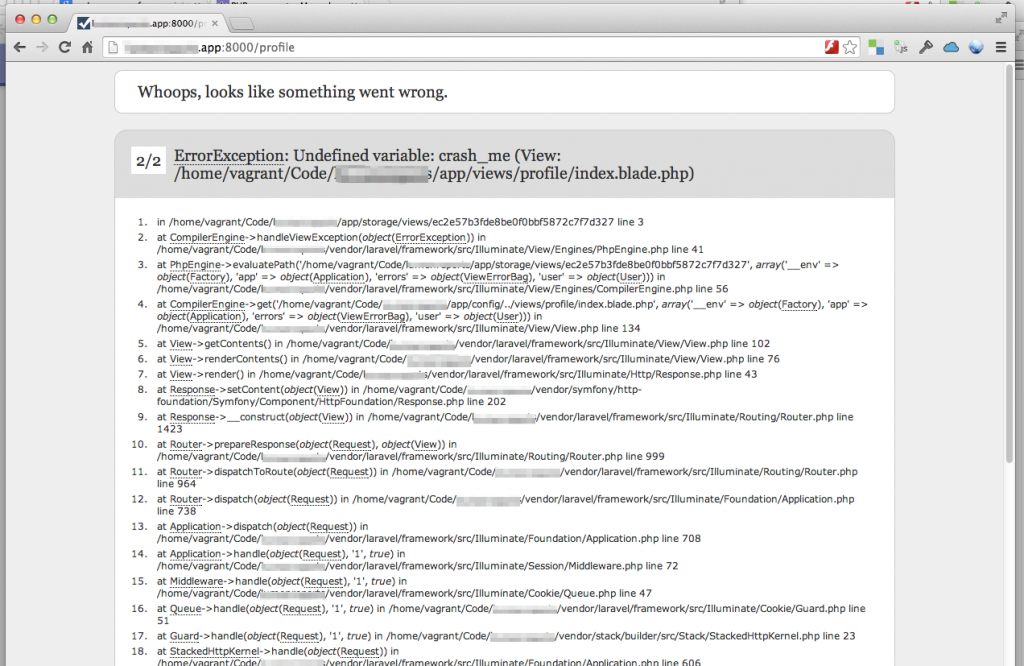
If you’ve spent any amount of time writing code, you’ll know that debugging is a vital part of the process. Sometimes it can be challenging to work out why your program has crashed or stopped working. It can be frustrating to encounter an error that doesn’t seem to make sense.
Knowing this, it’s wise to expand the tools in your debugging toolbox. When you add new tools and review well-used ones, you can make debugging quicker and more satisfying.
This article is about one such tool: the stack trace.

What Is a Stack Trace?
I imagine you’ve seen a stack trace before. At first, it can look like an impenetrable block of jargon and code. It might resemble a list of statements, each seeming more meaningless than the last. Each point on the list may refer to a file you may never have known existed. In reality, this is the PHP interpreter trying to communicate what has gone wrong and help you fix it. It’s possible to understand this text and use it to make your programs better.

When your program is running, the PHP interpreter keeps track of which function is currently running. Not only that, but the interpreter also keeps track of which function called the current function, and so on, all the way down to the entry function of the program.
The interpreter does this using a data type called a stack. You can imagine it as a stack of cards. A card either goes on top or gets taken from the top.
For our case, we’re interested in the call stack. As your program calls a function, that function goes the top of the call stack. When the function returns, your program removes it from the top of that stack. So the stack trace is a list of the functions in the call stack at the point an exception is triggered.
Throwing an exception is how the interpreter tells you an error has happened. This could be from a mistyped variable, incorrect input, or any type of exception that you’ve defined in your code.
What Does the Stack Trace Look Like?
I’m going to use a simple procedural example to generate my stack trace. Traces from frameworks and your own more developed applications are likely to be longer. However, looking at the simplest version helps you understand more complex, real-world examples.
Here’s my script:
<?php

function divide_by_zero (int $number)
{
  return $number / 0;
}

echo(divide_by_zero(10));
I spent over a decade teaching secondary mathematics, so I can see this is going to cause a problem. Running the program gives me the following stack trace:
PHP Warning:  Division by zero in /home/kevinc/Documents/workspace/php/test.php on line 6
PHP Stack trace:
PHP   1. {main}() /home/kevinc/Documents/workspace/php/test.php:0
PHP   2. divide_by_zero() /home/kevinc/Documents/workspace/php/test.php:9
The trace starts with a PHP warning, which tries to explain what the problem is and where it happens. In my case, a “division by zero” error happened in line 6.
It’s important to read the stack trace in reverse order—in other words, from the bottom up. My stack has only two items. The function running at the point the program threw an exception is at the bottom. This is my helpfully named divide_by_zero function. Reading up a level, you can see the {main} function called this function, and the {main} function is the entry to the program. The number after the colon is the line number that the interpreter thinks the error has happened in. (Pro tip: Sometimes it’s useful to look one line back and make sure there’s a semicolon ending that line.)
Having the full trace is important. You can follow it like breadcrumbs back through your program. Your function may fail under certain circumstances only. Maybe it works most of the time, but when called in a particular chain, it fails. Seeing the chain of events that led to the error can help you unpick the problem.
How Does the Stack Trace Help With Debugging?
With the stack trace, it’s possible to work out the entire chain of events that led to the exception being thrown. Now that you know where the error has happened, you can add some logging. The error is happening on this line, so what’s the state of the program just before this? If your application is in production, you can export these logs to a service like Scalyr. Scalyr can aggregate these logs for you and allow you to get an overview of how often the error is happening.
Just as important: How about adding some logging in the functions further up the call stack? You now know every function involved in creating this particular error. With this information, you can run experiments and test ideas with more precision. There’s a helpful datasheet here to help think about how to manage your logs as the amount of data you collect increases.
Xdebug and IDE Integration
Xdebug is a popular tool that gives you more insight into what is happening while your code executes. It’s a PHP extension that lends a helping hand when you’re debugging your applications. This tool allows you to interact directly with running PHP scripts, allowing you to step through the program and observe what’s happening. With Xdebug, you can deal with problems that are complex and nuanced without relying solely on log statements. When integrated with your IDE, Xdebug allows your debugging to go up another level. You can integrate this tool with most code editors, including VSCode and even VIM.

With Xdebug set up and configured, you can set a breakpoint on the line where there’s an exception or error. Doing this allows you to interrupt the program and investigate. You’ll be able to see the live call stack and the variables currently in memory. You can execute commands and test ideas while the program is live. This is a powerful debugging technique.
Stack Trace Without Errors
With Xdebug, you can generate a stack trace at any point in your program. Maybe the program isn’t throwing an error, but it doesn’t seem to be working as you expected it to. Or, as mentioned earlier, you could have a function that works in certain circumstances but not in others.
Xdebug provides a set of debugging functions that you can put to good use. This one is the most useful for our needs:
xdebug_print_function_stack(string message);
Adding the command above will print the call stack, along with your message, without interrupting the program. You could add this to your temperamental function, allowing you to see the call stack—when it succeeds and when it fails. Combining these sets of information can help you identify issues more quickly.
You can read more about the other debugging functions that Xdebug provides in the documentation.
However, this kind of command in production can either confuse a user or give someone with malicious intent too much information. For this reason, it makes sense to ensure your production environment has display_errors set to Off in the live php.ini file.
Conclusion
I hope this brief article allows you to understand the stack trace and think a bit more about how you might use it. As I’ve mentioned, it’s a really helpful tool and can help you identify and solve errors quickly.
In local development, tools like Xdebug allow your debugging efforts to be truly effective. In your production environment, using logging and log aggregation can allow you to succeed there as well.
If you’re just getting started in collecting stack traces and logs, check out this workshop!


