CloudWatch is a suite of cloud-native visualization tools for Amazon Web Services (AWS) monitoring and logging. Accessing CloudWatch metrics removes the uncertainty that creeps in when your applications hosted on AWS stop working as they should. Engineers, database administrators, and other nontechnical members can gain insights into the state of applications through user-friendly graphs and charts in CloudWatch. This allows quicker troubleshooting and resource allocation decisions for peak application performance.
This post will guide you through the process of using CloudWatch metrics. A brief history of the service, along with some references of thought, will serve as the introduction to what will potentially become a staple for how you keep tabs on your entire AWS account.

Why You Should Use CloudWatch
Going back in time, Amazon was among the first providers of cloud storage and compute services to engineers on a global scale. At the very least, Amazon pushed AWS such that, at the time of this writing, 31% of the market operates with some feature created by them. That said, using CloudWatch—a tool that goes into the logging and display of data that most of the internet uses—is a wise move.
In addition to the beautiful presentation of logs metrics, CloudWatch can alert engineers and administrators of events when they occur. Perhaps the most powerful feature you’ll encounter above all else is the ability to configure automatic reactions triggered by said events. However, we’ll get into the details of this hit feature in a bit.

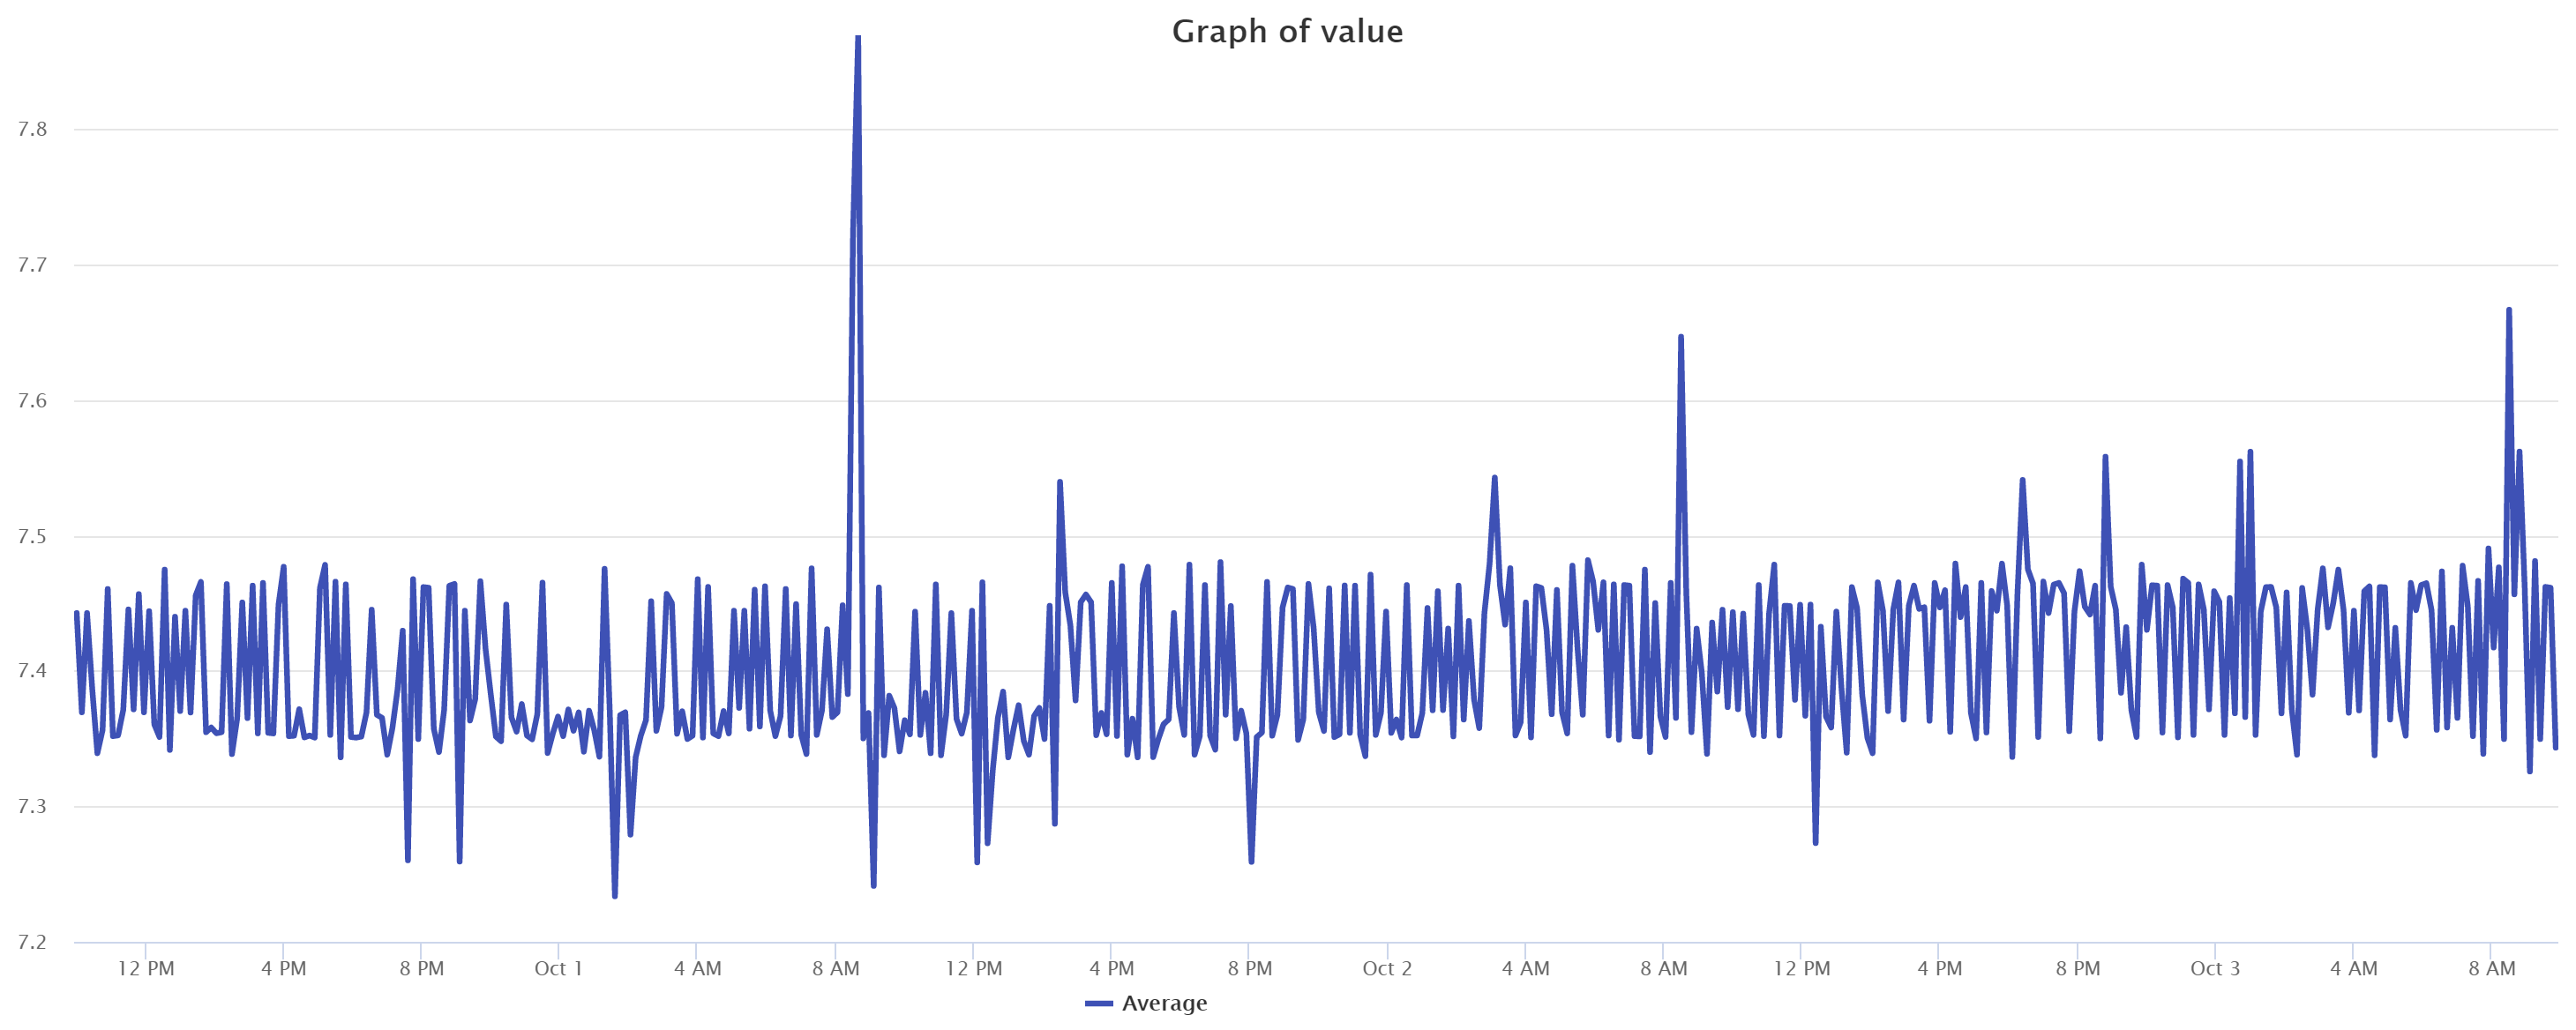
Although it’s a simple and straightforward feature, the most alluring of all CloudWatch features has to be data visualization. This comes in the form of charts and graphs connected to various apps and services. The visual elements provide an engineer with accurate updates on most natively managed resources.
You access these updates on a progressive model through charts displayed on dashboards.
AWS CloudWatch Dashboard
By default, you’re able to access the usual important information concerning the status of an AWS instance. This includes CPU load logs, network latency, request volume, and other RDS and EC2 metrics.
At any given time, an engineer can obtain valuable information from the charts and graphs that make up CloudWatch dashboards. Each of these would be pulling data from the applications around and within an AWS instance. This information fills in the gaps often created when AWS services are coupled to host applications in the cloud.
To fully understand what CloudWatch can do, let’s examine a few use cases for the various tools it avails.
CloudWatch Metrics and Use Cases
The following use cases are situations for which installing the CloudWatch agent enhances data visibility. A large chunk of AWS users will find value in the basic tier of CloudWatch. It comes preconfigured to automatically monitor EC2 resources at no extra charge.
Before we dive into the various cases for which CloudWatch applies, it should be noted that not all implementations of it are equal.
At the basic measuring tier, CloudWatch keeps tabs on seven metrics at five-minute intervals. In addition to these seven, an additional three status-check metrics also attract free monitoring. For these few, you get more accurate readings at refresh intervals of just a minute.
There are instances for which these refresh rates are anything but sufficient. To that end, CloudWatch provides detailed monitoring at an additional cost to your regular EC2 charges. In this tier, all the metrics in the basic tier come on a “per-minute” basis. This helps you figure out when a system-state-altering event actually happens. All this translates to more troubleshooting power the very instant it’s activated.
CloudWatch Metrics for Linux OS
Your preferred operating system (OS) has no impact on CloudWatch’s capabilities when monitoring and displaying metrics. As such, the installation and configuration of its agent on your cloud or on-premise environments are at this point taken for granted due to the availability of documentation. However, you should first consult said documentation for a full list of compatible OSs and their relative installation procedures.
While the variables below are relevant to Linux instances, they are among the metrics an AWS CloudWatch agent will provide.
CPU Time Active
cpu_time_active
This is a measure of the overall time that your environment’s processor is active. On a chart, you can discern the exact time your server went offline. This comes in handy when matching logs with other events from applications. Troubleshooting such a scenario puts triggers in the spotlight. The outcome from monitoring this metric is presented in fine sections of a second (one hundredth, to be precise).
CloudWatch CPU Activity Metrics
cpu_time_idle
The other side of the activity coin is idle time. Monitoring how much time your instance isn’t carrying out any process helps you know when you don’t need resources at full capacity. Provisioning this idle time to tasks that require a lot of power would be a wise move. The thing is, you can only know when such times occur by having monitored and confirmed the CPU idle time variable. This metric is also measured to the hundredth of every passing unit of time.
Amazon S3 Bucket Metrics
S3 is Amazon’s storage solution for applications that thrive on the distributed network model on which the cloud is based (the simply named “Simple Storage Service”). Metrics from pairing CloudWatch and S3 help engineers determine how much action is taking place between databases and applications.
Sample metrics that might be of interest to this context include the following:
An Account of Storage Size
BucketSizeBytes
Measured in bytes, this is an incrementing amount of space occupied by all objects in a bucket. While each object type can be isolated for further insights, knowing how much space you’ve consumed helps you plan for extra resources beforehand.
HTTP Requests CloudWatch Metrics
AllRequests
This metric returns the total count of HTTP requests that occurred on a bucket. It does not filter the direction of the request (GET or SEND). However, you have the option to filter further whenever any direction makes more sense to your interrogation.
Getting the Most From CloudWatch: Best Practices
Now that you know the fundamentals of CloudWatch metrics, the next step would be knowing how to apply them with the intent of attaining the best outcomes. Most important at this stage is knowing that your unique infrastructure and application setup (stack) require active input on your part to monitor. The same effort would be nice to invest in to maintain peak performance across the network.

Monitoring discreet environments and applications often requires that you log in and out of various services. However, this isn’t an efficient way of keeping tabs on your AWS instances. This applies to both on-premise and cloud-stored resources. Knowing this, Amazon itself provisioned the CloudWatch agent API. Using the CloudWatch metrics API, you can pull in data from your AWS account into third-party dashboards for quick and centralized access.
This brings us to the combined use case and convenience that comes with implementing Scalyr. In addition to its advanced aggregation and querying features, Scalyr pulls in data from your AWS account provisions and displays them on a clean dashboard.

Pairing the data from AWS within other applications you’re already using is a good way to squeeze the most from CloudWatch metrics. To see what this would look like, the free trial offered when you sign up for Scalyr allows you to run queries and reports with sample data before plugging in live data. That’s yet another good practice to adhere to as an engineer in order to gauge compatibility before exposing your data to external applications.


