Here at Scalyr, we’ve been having a lot of fun building out a high-speed query engine for log data, and a snappy UI using AngularJS. However, we haven’t had a good way to show it off: a data exploration tool is useless without data to explore. This has been a challenge when it comes to giving people a way to play with Scalyr Logs before signing up. We recently learned that Github provides a feed of all actions on public repositories. That sounded like a fun basis for a demo, so we began importing the feed. (To explore the data yourself, see the last paragraph.)
We’re collecting data from two sources. One is Github’s official API for retrieving events on public repositories, https://api.github.com/events. The other is https://github.com/timeline, an unofficial feed which contains similar data. Each provides some information not included in the other.
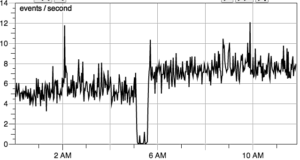
Playing around, we noticed some occasional holes in the data — here’s a graph from Oct. 19:
Looking at the message history on https://status.github.com, it seems that Github reported an outage at that time. We have an internal alert on problems with our import of Github data, but so far every blip has turned out to be at Github’s end. (Note: we love Github, and use it ourselves. Just don’t expect it to be a five-nines service.)
It’s fun to play around with this data. There are around 1 million events per day, which we handle very easily. One nice thing about Scalyr Logs is that it allows you to explore interactively. You can search and filter on the fly and view graphs and value distributions. I found it oddly reassuring that the word “fixed” appears much more often in commit comments than the word “broken”:
Interestingly, “fixed” has a stronger circadian cycle than “broken”. Perhaps robots are breaking things, and humans are fixing them? Graphing checkins by authors in various (self-reported) locations shows that — surprise! — San Franciscans get up later in the day than Europeans:

And the daily cycle seems to be pretty stable — here is a comparison of the last 48 hours, with the same period two weeks earlier:

Side note: on the day I’m writing this, Batavia, Illinois is the most common location, beating out both San Francisco and “none specified”. It turns out that a single user in that town has been quite busy this morning:

Programming languages appear to be well distributed across time zones:

Searching for random keywords can be fun. A quick search for “Unicorn” turns up things like this:
I wonder what it means to “Switch to unicorn from passenger”? This comes from https://github.com/cconstantine/wattle, if you’re curious.
And if you have suggestions for other public data sets that would be fun for us to publish — drop us a line at [email protected]!


